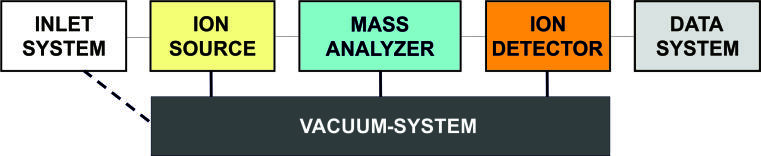
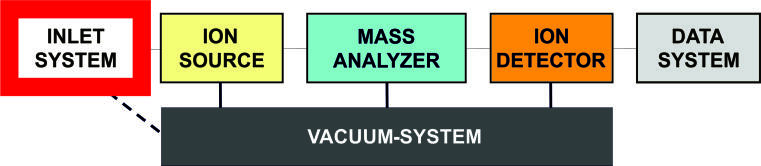
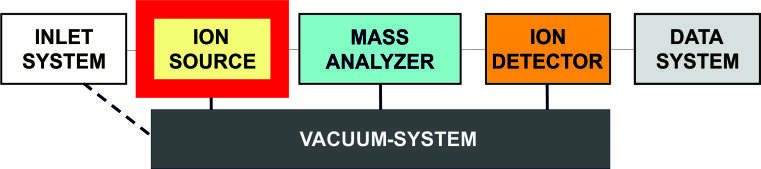
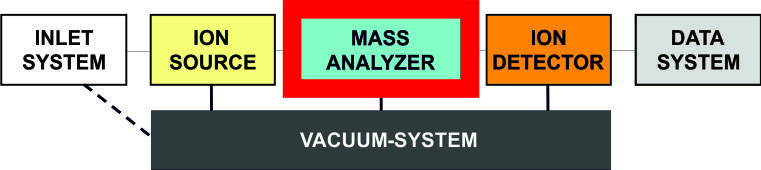
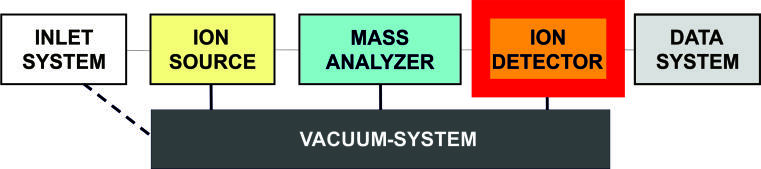
There are different technical options for each component, but not all combinations are possible.
Which combinations make sense depends on the type of sample and the problem.
(This list is not exhaustive, but it is based on which methods are currently used in this department - there are more methods than can be shown here!)
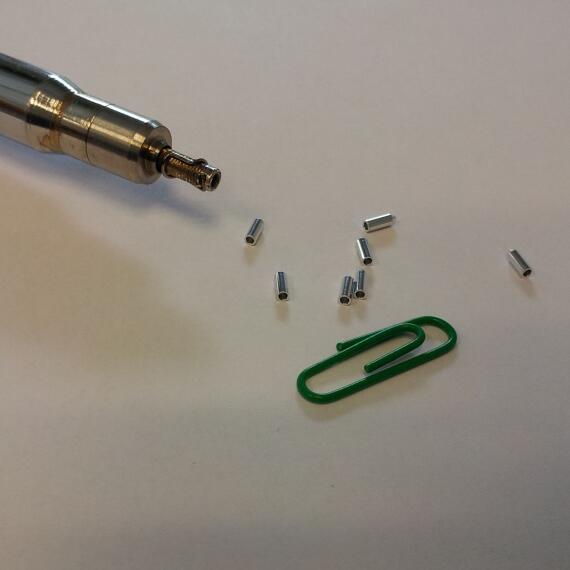
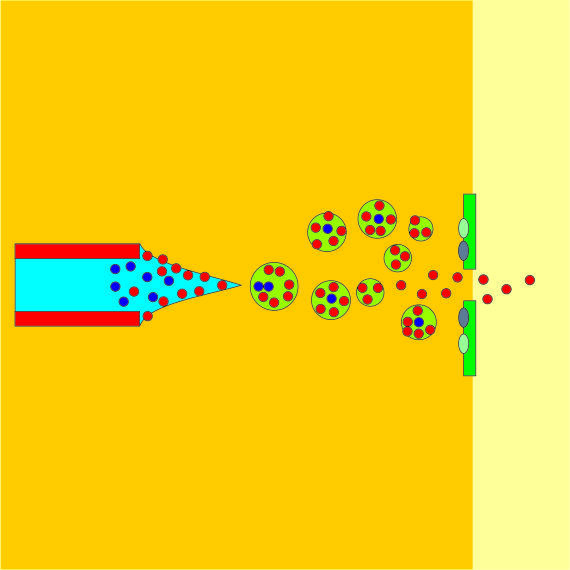
Direct inlet, solid probe inlet: A small amount (0.01 to 0.1) μg of the specimen is placed in a tiny aluminium crucible on the top of a push rod. In most cases it is applied as a diluted solution. Some microlitres of this solution is filled in the crucible and the solvent is evaporated. Then the rod is pushed through a vacuum lock into the analyzer. The temperature of the crucible is raised to evaporate the compound (range 30° to 400°C). So different volatile compounds can be separated.
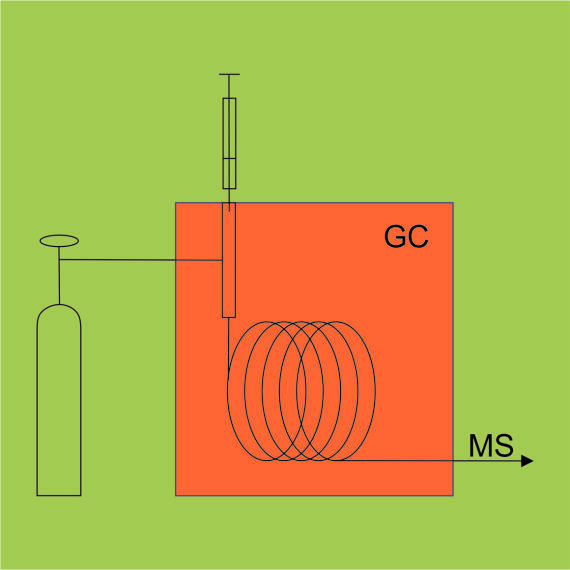
Gas chromatography: The compounds of the sample are separated by gas chromatography. The separation column ends direclty in the ion source. Suitable for all mixtures which are stable due to GC-conditions.
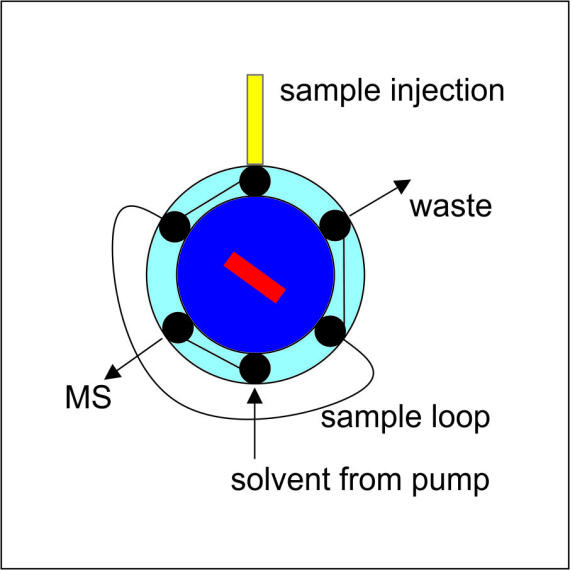
Loop inlet: 1..20µl of the dissolved sample is injected into a sample loop. Then the sample is transported with a solvent flow (appr. 50µl/min) to an ESI mass spectrometer. There is no separation effect.
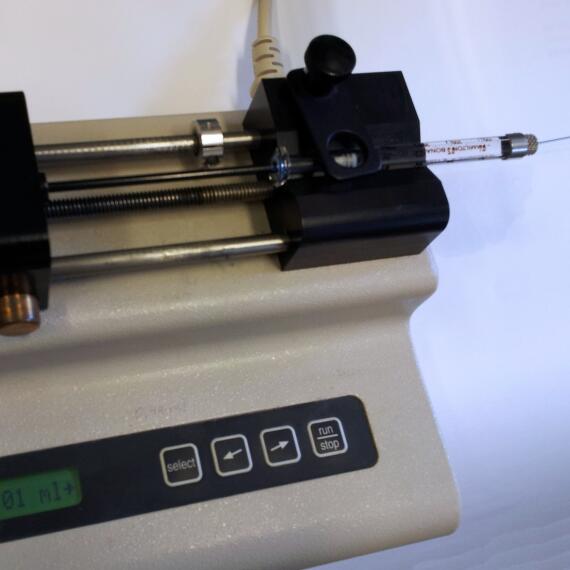
Syringe inlet: 10..100µl of the dissolved sample loaded into a syringe. A syringe pump transports the sample with a constant volume flow into the ion source. There is no separation effect.
Liquid chromatography, HPLC: The compounds of the sample are separated by liquid chromatography and run through a UV-detector then they are analysed in an ESI mass spectrometer. Very suitable for the analysis of polar and medium polar compounds.
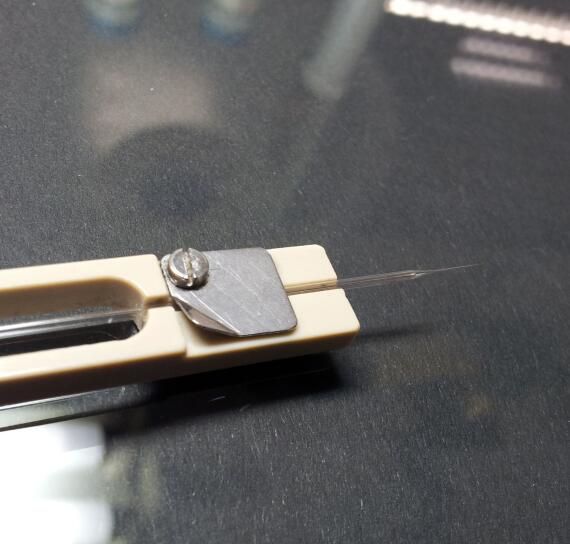
Nanospray: 10µl of the dissolved sample is injected into a capillary. The solution is charged up to 1KV with an inserted steel wire. Because of the strong electrical field at the tip of the capillary, the solution is sprayed. There is no separation effect.
matrix preparation: The sample is mixed (1:50.. 1:10000) with a matrix (e.g. 2,5 dihydroxybenzoic acid) and is co-cristallized on the sample carrier, which is transferred into high vacuum. Laserpulses are used for the ionisation.
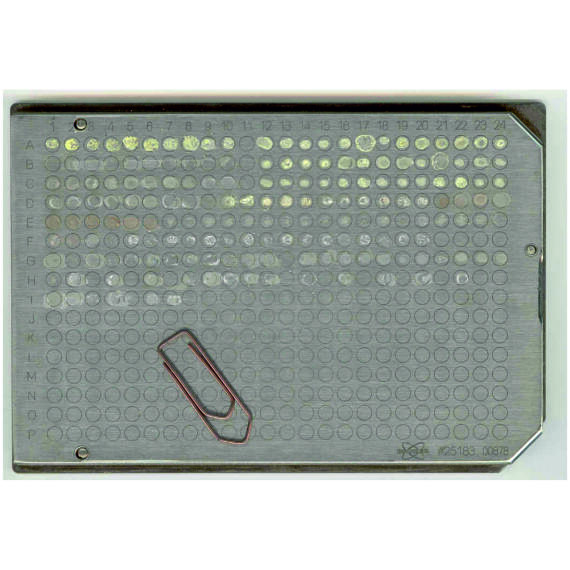
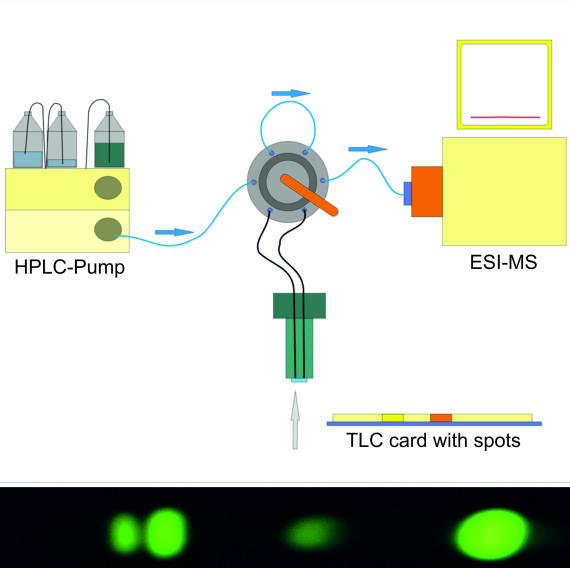
Thin Layer Chromatography, TLC-MS: The sample is separated on a thin layer plate. After localizing the spots of the substances they are eluted by an extractor. The eluate can directly be transferred to a mass spectrometer.
Ionisation: ESI or APCI
Information about this method: DGMS-HL.pdf (german language)
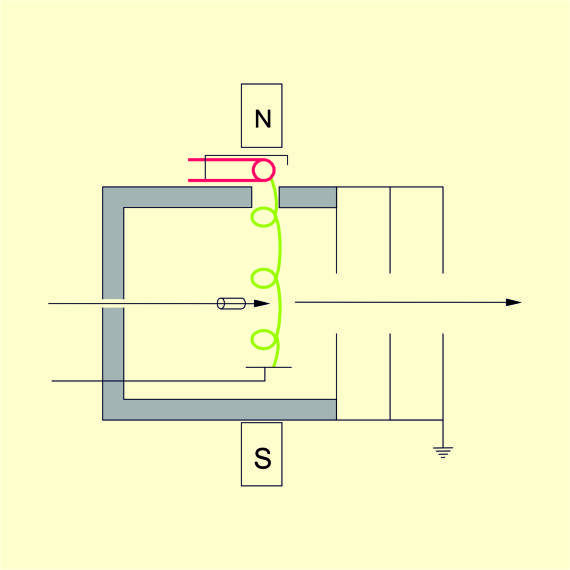
Electron Ionization (EI): In vacuum molecules are ionized by the impact of accelerated (70eV) electrons. Mostly radical cations are formed. 6-11eV of the transferred energy are needed for ionisation, but also 2-10eV of excess energy is passed. Therefore a more or less strong fragmentation occures. The fragmentation pattern is very characteristic for an organic compound, therefore data base searches are well established.
All molecules (if aporized without decomposition) can be ionized by this method. The method is "non-specific“.
Electrosprayionisation, ESI or ES: The sample is dissolved and the solution must show some electrical conductivity. Preferred solvents are water, methanol, acetonitrile if necessary mixed with nonpolar solvents (CHCl3, CH2Cl2…). In the solution charged particles are formed. Positive ions by the addition of cations (H+, Na+, NH4+…). Negative Ions by deprotonation or by addition of anions (Cl-, HCOO-, Acetat..). The forming of ions can be aided by adding salts or changing the pH-level. The so formed ions in the solution are separated from the solvent by spraying in an electrical field under athmospheric pressure. Then the ions are transported to the mass analyser.
Positive Ions
Negative Ions
[M + H]+
[M - H]-
[M + NH4]+
[M + Cl]-
[M + Na]+
[M + HCOO]-
[M + K]+
Depending on the chemistry of the sample, also multiple charged particles and agglomerations of molecules are formed.
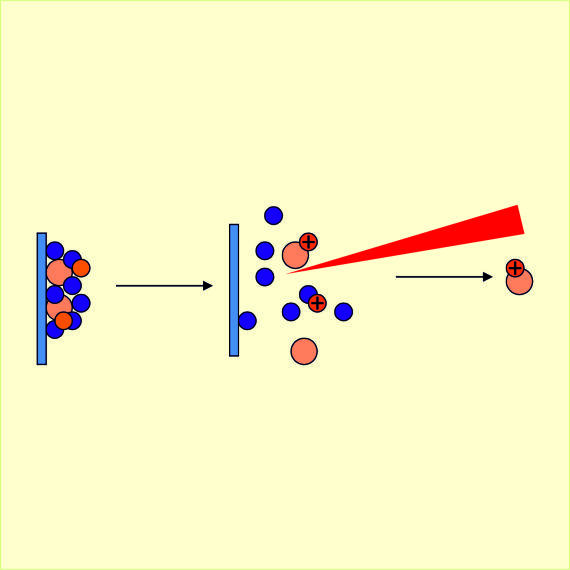
Laserionisation, see also matrix preparation (-> Matrix Assisted Laser Desorption/Ionization): With a very short laser pulse the sample is vaporized within the high vacuum. Thereby positive and negative ions are formed. Mostly a nitrogen laser with a wavelength of 337nm and a pulse duration of 3ns is used. Normally the irradiation intensity is in the range of 0.5 to 5 MW/cm2.
Positive Ions
Negative Ions
[M + H]+
[M - H]-
[M + NH4]+
[M + Cl]-
[M + Na]+
[M + HCOO]-
[M + K]+
In contrast to ESI preferred single charged ions occur with MALDI. This ionisation method is commonly combined with a time of flight mass analyser.
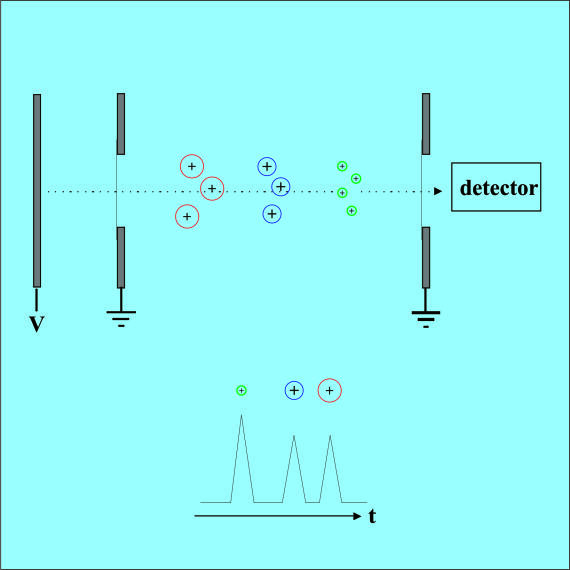
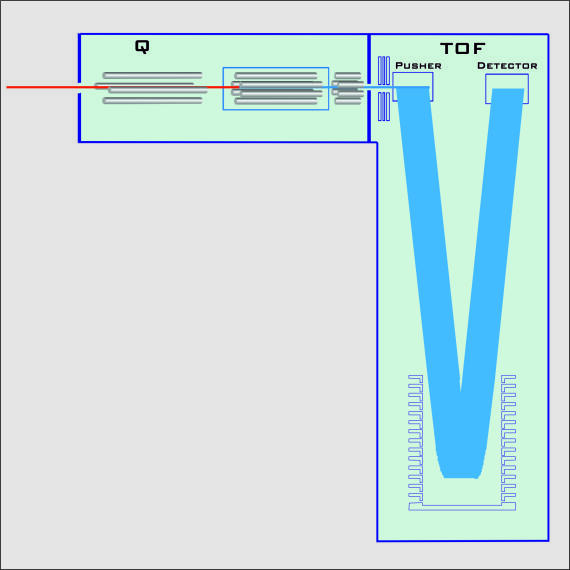
Time of flight analyzer TOF: This type of analyser is often used with ion sources where the ions are produced in short pulses. After accelerated in a short electric field (10-20kV) the ions pass a long field-free region. The flight time is correlated with m/z. To increase mass resolution the acceleration is accomplished into steps (DE –delayed extraction). To correct for image errors and to elongate the flight time the ion path can be folded by a reflector.
Orthogonal Time of flight analyzer, oTOF: If there is a continuous ion production the initial ion movement must be decoupled from the ToF measurement. This is done by orthogonal extraction of the ions to the flight tube. With this principle very high resolutions can be achieved.
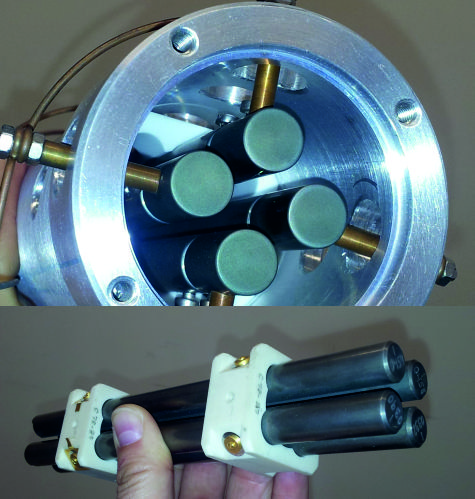
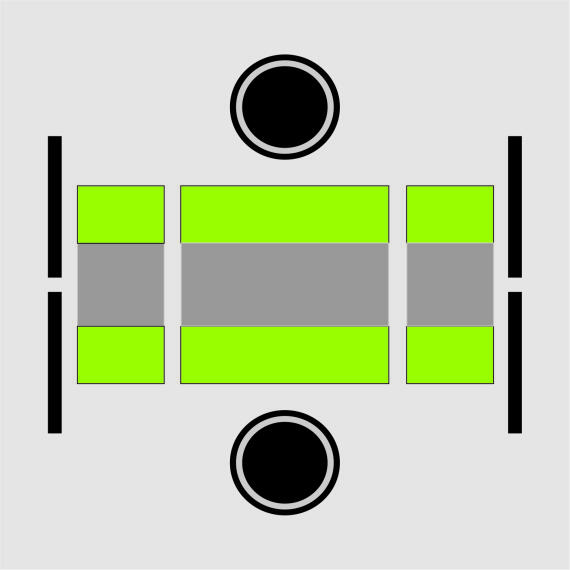
Linear quadrupol mass analyzer: In this analyser slowly moving ions are forced to oscillation by an alternating electrical field between four parallel poles. By changing the parameters all ions (rf-only mode) or only ions of a small mass range pass the poles. The resolution of such a mass filter is limited to 1/4 Da peak width.
This type of analysers can be connected in series. MS-MS experiments are possible by a chamber filled with gas (if required) between two analysers (Triple Quad MS).
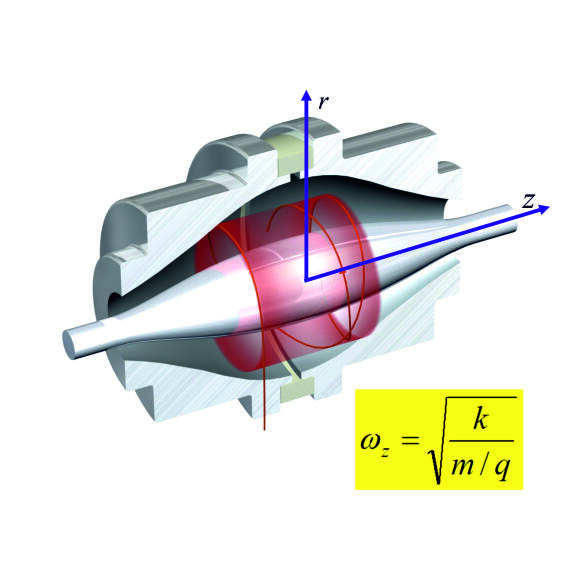
Linear ion trap: Ions are trapped in a quadrupole structure by an alternating electrical field and electrical potentials at the ends. By scanning the quadrupole voltage ions leave the trap sorted by their m/z values and are detected by the detectors outside.
Such an ion trap is capable of multi-level MS-MS experiments. With the ion trap of the department (LTQ Orbitrap XL) ions can be detected by the (destructive) detectors or can be passed on to an orbitrap for a more precise mass analysis.
Orbitrap: this very new analyser principle has a high resolution (100.000) and mass accuracy (below 0.002 u). In the LTQ Orbitrap XL a linear ion trap is connected to an Orbitrap analyzer.
In this analyser a ring of ions is oscillating along a central electrode in direct axis. The frequency of the oscillation is used for the mass analysis.
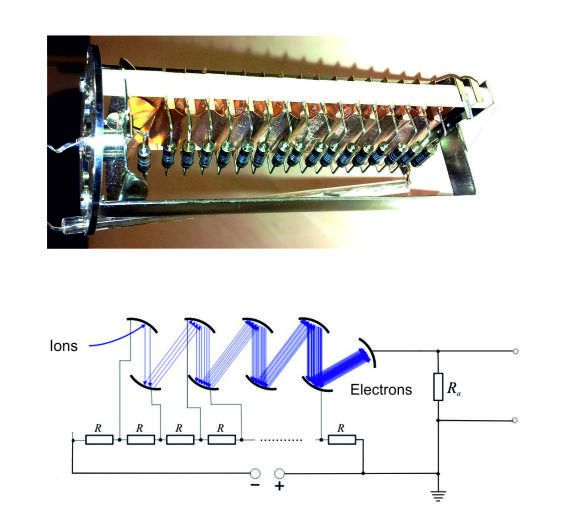
Electron multiplier: A conversion dynode is hit by ions and their impulse excites electrons. These electrons are pulled by a positive ca. 100V higher charged electrode where they release more electrons. This process repeats as a cascade between increasing charged electrodes. Finally a highly amplified signal is available. There are many derivatives of this device, some discrete, some working with semi conductive surfaces, but all use the same principle.
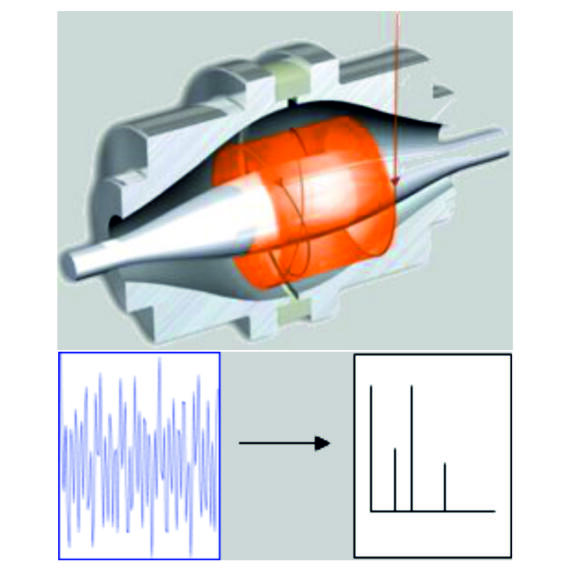
Fourier transform MS: This ion detection is used with the Orbitrap (or in Ion Cyclotron Resonance MS). The signal is a mixture of frequencies which represent the m/z values of the ions. By a fourier transformation the single fractions of the frequenzies are determined. Because frequencies can be measured very accurately, this system provides accurate m/z values with a extraordinary resolution. This method of ion detection is non-destructive!
Device control / data acquisition: there is a particular software for each mass spectrometer.
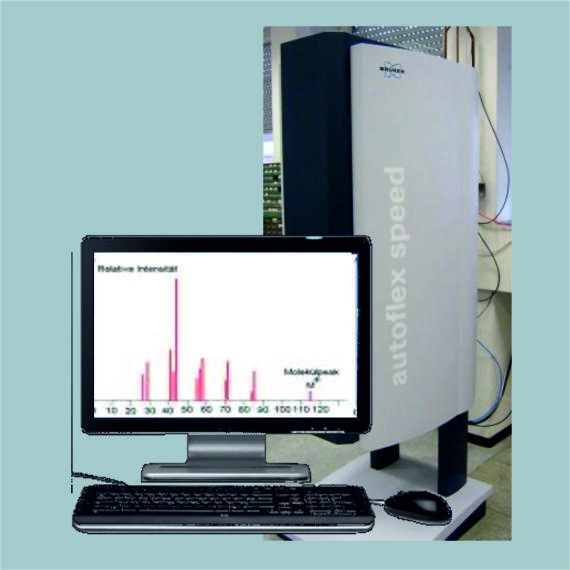
Compass (Bruker Daltonics): for AutoFlex Speed (MALDI TOF): This software package contains FlexControl (mass spectrometer control) and FlexAnalysis (data processing). FlexImaging is a separate tool for processing and evaluation of MALDI-Imaging experiments.
Compass (Bruker Daltonics): for MicroTof: This software package contains Hystar (HPLC-control), MicroTof-Control (mass spectrometer control) and DataAnalysis (data processing).
MassLynx (Waters, ehem. Micromass): Acquisition and processing for Quattro LCZ, Quattro Micro GC.
Xcalibur (Thermo Fisher Scientific): Acquisition and processing for TSQ und LTQ Orbitrap XL.
Chemstation (Agilent): Agilent 6110. This program is only used for device control and data acquisition. The data evaluation is done with the DataAnalysis software from Bruker Daltonics.
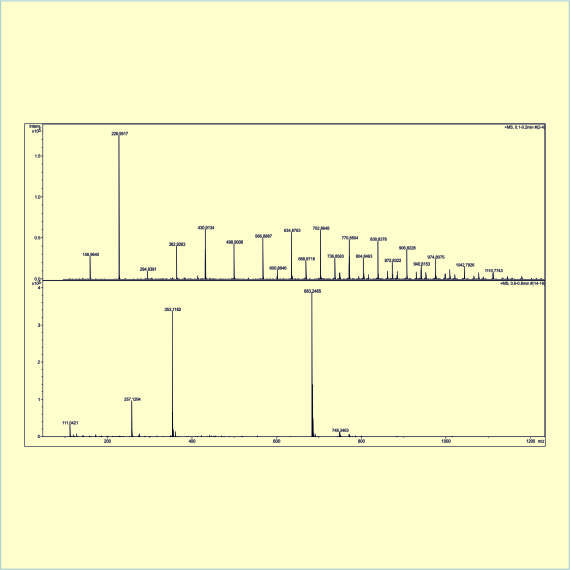
Data format: The data formats are proprietary. There are some export functions in the software but often some information is lost (e.g. measurement parameters). Exporting the data to an ASCII-file produces gigantic large datasets even for the devices with high accuracy.
For using the spectra and chromatograms in publications it is best to display them with the original software and then export them as graphic. The co-workers of the mass spectrometry department can inform you about the possibilities.
Especially for EI mass spectra there are large collections of spectra (databases) by different vendors like NIST, Wiley or (AIST) SDBS. Often those databases are integrated into the instrument software so that it is easily possible to search with a measured mass spectrum in the database in order to identify unkowns. SDBS is a japanese database, which is freely accessible via the internet. Also for MS/MS spectra from ESI or MALDI measurements there are increasing collections of spectra available, though a database search is less easy because of the lower reproducibility of MS/MS spectra from different instrument types.
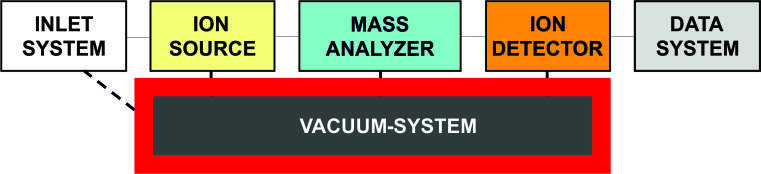
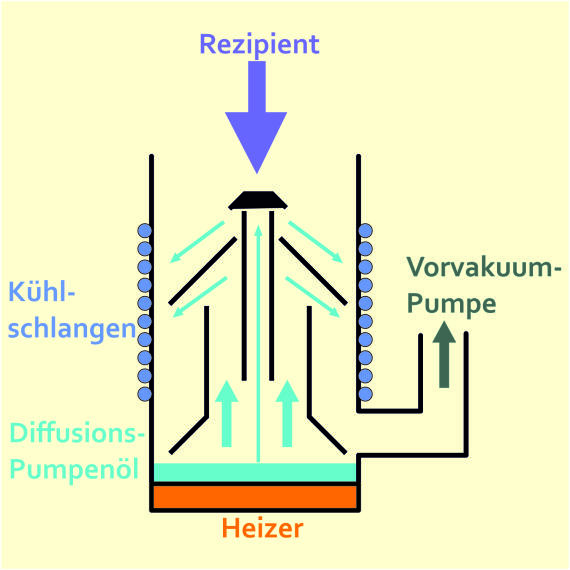
For each mass spectrometer a good vacuum is needed at least after the ion source, so that mass analyzer and detector may work and for the ions to reach the detector without collisions with remaining gas molecules. Therefore sophisticated pumping systems are required to reach a final vacuum of down to 10-11 mbar depending on the analyzer system. This cannot be achieved by a single stage pumping system, therefore often a combination of prevacuum pump (often a rotary pump) and a fine vacuum pump (turbomolecular or diffusion pump) is used.
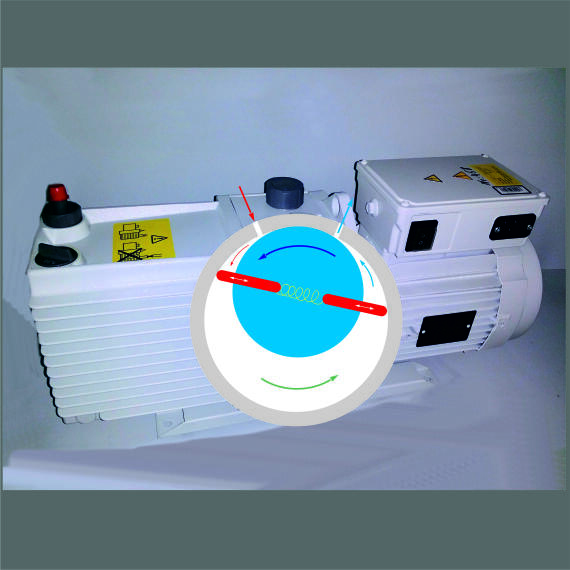
A rotary vane pump is a positive-displacement pump that consists of vanes mounted to a rotor that rotates eccentrically inside of a cavity. In some cases these vanes can have variable length and/or be tensioned to maintain contact with the walls as the pump rotates. Often rotary pumps for mass spectrometry are two stage pumps, consisting of two sequential rotary vane pump stages in order to achieve a final vacuum of about 10-4 mbar.
The turbomolecular pump works like a turbine of an airoplane with fast rotating blades. When hitting those blades gas molecules are transported in axial direction towards a prevacuum pump. For an efficient pumping the pump consists of a large number of blades rotating up to 90.000 rpm.
Turbomolekularpumpen benötigen einen Vorvakuumdruck von ca. 0.1 mbar; sie erreichen Enddrücke bis ca. 10−10 mbar.
The pump consists of a cylindrical body. The bottom contains a heater, which heats up the diffusion pump oil. The heated oil is sprayed into the pump body by a nozzle system. It condenses on the cooled walls of the body. Gas molecules, are captured by the oil when reaching the steam and are transported down to the higher pressure area. There is the exit to the prevacuum pump. By heating up the oil again, captured molecules are released and removed by the prevacuum pump. Diffusion pumps need a prevacuum of at approx. 0.1 mbar; they may reach a fine vacuum of 10−9 mbar depending on the vapor pressure of the pump oil.