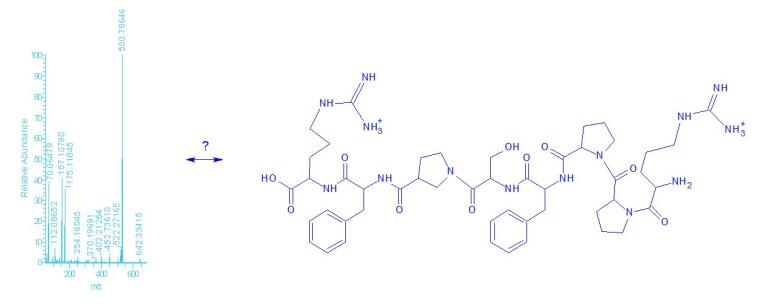
Spectra Interpretation

Bradyspec
© MLE

You will find many features of a molecule in a mass spectrum – but not all (sorry)!

  • To find out the molecular weight of a compound is the basic task for mass spectrometry.
  • If this is done precisely, it is possible to determine the elemental composition.
  • If there are isomers with strongly different structure, then there is a good chance to get information about this. E.g. alternative sequences in peptides, positional variations of functional etc.
  • In case of structure variations in areas of the molecules which do not participate in mass spectrometric fragmentation, you will not see this variations in the spectra.
  • Some isomers e.g. E/Z, diastereomers, optical isomers cannot be differentiated by mass spectrometry.
  • Spectra Interpretation

    The printouts of measurements contain a lot of information. For a better understanding we provide a PDF-file with examples including some usefull comments.

    Spektra with comments as PDF-file (NEW!)

    Interpretation mass spectra – starting points


    Recommended steps for the interpretation of EI spectra:

    • Calculate the molecular weights of all components which are used in your reaction mixture and all expected products (drawing programs like ChemSketch – distributed freely by ACD-labs - can help).
    • Look on the "character" of the spectrum (wether it contains many peaks of similar intensity, only few peaks, series of peaks etc.). Does this fit with the expected behaviour of your target compound?
    • Represents the spectrum a ubiquitous impurity (plasticizer, anti-oxidant, etc)?
    • Look for peaks in the high mass region, try to figure out the molecular ion. Control wether the first fragmentations are „possible“ and reasonable fragmentations.
    • Often fragmentation is so rapid that no molecular ion can be observed. Look for likely fragmentations (e.g. loss of H2O (alcohols), MeOH (Me-esters), CH3 (TMS compounds) and many other methyl group containing molcules).
    • Regard the isotope pattern of the peaks, especially the molecular ion group.
    • Try to correlate the fragmentation with the expected structure. Mass differences, key fragments etc.
    • If the spectrum is known in a spectra collection (e.g. NIST) compare it, if not, try to find similar spectra and compare the associated structures.


    Recommended steps for the interpretation of MALDI spectra:

    • What matrix was used, which ions are expected from the matrix. E.g. DHB m/z 137, 154, 155, 177, 273, 362; DCTB m/z 235, 250, 500, 750, 1000.
    • Regard your target structures, if they are basic (amines etc.) expect to see protonated species, if they have multiple functional groups, expect to see complexes with sodium and/or other cations; if they are salts look for the cation mass. Appropriate arguments are valid for negative ions.
    • Expect to see more than one pseudomolecular ion from one compound, e.g. [M+H]+ and [M+Na]+ or in the negative mode [M-H]- and [M+Cl]-.
    • The type of ionization is not only ruled by the compound but also by the matrix and salt additives (pH, buffer salts).
    • When the compound is easily oxidized or reduced, often radical cations (or anions) are formed by nonprotic matrices.
    • Because the TOFs (theoretical) are not limited in the mass range but are limited resulution, there is often the situation, that in the low m/z range the peaks are isotopically resolved, but not in the high m/z range. When calculating the masses please use the appropriate mass values! The mass accuracy of the TOF analyzers depend on the construction and the measuring conditions. With the Autoflex Speed (or Reflex IV) it is approx. ±0.01% of the actual mass.


    Recommended steps for the interpretation of ESI-spectra:

    • Regard your expected structures, if they are basic (amines etc.) expect to see protonated species, if they have multiple functional groups, expect to see complexes with sodium and/or other cations, if they are salts look for the cation mass. Appropriate arguments are valid for negative ions.
    • Expect to see more than one pseudomolecular ion from one compound, e.g. [M+H]+ and [M+Na]+ or [M-H]- and [M+Cl]-.
    • The type of ionization is not only ruled by the compound but also by the solvent system (pH, buffer salts); high buffer or salt concentrations must be avoided!
    • If the size of the molecules increases the chance to observe double (multiple) charged ions increases e.g. [M+2H]2+. These can be recognized by the distance of their isotope peaks (1 Da for singly ½ Da for doubly, 1/3 Da for triply charged molecules etc.).
    • Often two (or more) molecules share a common cation, these structures are often called „coulomb dimers“ e.g. [2M+Na]+.
    • Fragmentations are rare in standard mode, they can be forced by changing the conditions (e.g. increasing the cone voltage).

    With our ESI-spectrometer Quattro LCZ we expect a mass accuracy of ± 0.2 Da in MS-mode, in MS/MS modes ± 0.4 Da is allowed.
    With exact mass measurements of the MicroTof mass spectrometer the accuracy is ±5 mDa, with the Orbitrap mass spectrometer the accuracy is normally better than 2 ppm.

    Exact Mass Determination

    The pure isotopes have masses which are not integer (except 12C). Therefore combinations of them, having the same integer mass their exact mass differ in the decimal places. If the mass measurement is precise enough, and there is no interference* with other peaks, one can distinguish between ions with different elemental compositions.
    Example:

    N2  28.006148016 Da
    C2H4  28.031300148 Da
    CO  27.994914640 Da
     
    Normally the accepted error is ±5 mDa or ±5 ppm (with masses > 1000).
    Keep in mind that an electron mass is ~0,55 mDa and has to be considered when calculating the exact mass of ions (Orbitrap, Microtof).


    * If there are overlapping peaks on the same integer mass (isobars) their exact masses can only be determined when the mass resolution is increased, so that they are well separated. This is called "high resolution". E.g. to determine the exact mass of N2 in the presence of CO a resolution of (at least) 4000 is needed.


  • Impurities

    A good database for impurities can bei found at MaConDa (Mass Spectrometry Contaminants Database).

    Electron Ionization (EI)

    The compounds are arranged with increasing exact mass of their molecular ions or most abundant fragment ions.
    m/z Art Summenformel (des Ions) Name und Herkunft
    149.0238  F+  C8H5O3+  Phthalates, especially Di-iso-octylphthalate, plasticizer 
    207.0323  F+  C5H15Si3O3+  Hexamethyltrisiloxan – CH3 Silicon Oil
    281.0511  F+  C7H21Si4O4+  Octamethyltetrasiloxan – CH3 Silicon Oil
    281.2713  M+  C18H35NO+  kleiner Peak, Oleamide, Oleic acid amide, lubricant for plastics (Syringe!) 

    F+ = prominent fragment within an EI Spectrum
    M+ = radical cation

    ESI / MALDI

    The compounds are arranged with increasing exact mass their pseudomolecular ions.
    m/z Art Summenformel (des Ions) Name und Herkunft
    102.1282  M+H+  C6H15NH+  Triethylamine, Di-isopropylamine 
    130.1590 M+ (C2H5)4N+ Tetraethyl ammonium
    169.0947  2M+Na+  (C3H7NO)2Na+  DMF Coulomb dimer 
    172.0944  M+Na+  C6H15NO3Na+  Triethanolamine 
    203.0526  M+Na+  C6H12O6Na+  Hexose 
    242.2842 M+ (C4H9)4N+ Tetrabutyl ammonium
    255.2329  M-H-  C16H31O2-  Palmitic acid anion 
    279.1590  M+H+  C16H22O4H+  Di-butylphthalate, plasticizer 
    282.2791  M+H+  C18H35NOH+  Oleamide, Oleic acid amide, lubricant for plastics (Syringe!) 
    283.2642  M-H-  C18H35O2-  Stearic acid anion 
    301.0752  M+Na+  C18H15PONa+  Triphenylphosphinoxide e
    301.1410  M+Na+  C16H22O4Na+  Di-butylphthalate, plasticizer 
    304.2610  M+Na+  C18H35NONa+  Oleamide, Oleic acid amide, lubricant for plastics (Syringe!) 
    360.3237 M+Na+ C22H43NONa+ Erucamide
    365.1054  M+Na+  C12H22O11Na+  Disaccharide 
    381.2971
     
    M+Na+  C21H42O4Na+  Glycerinmonostearate
     
    391.2842  M+H+  C24H38O4H+  Di-iso-octylphthalate, Weichmacher 
    393.2975 M+Na+ C22H42O4Na+ Bis(2-ethylhexyl) adipate, DOA
    413.2662  M+Na+  C24H38O4Na+  Di-iso-octylphthalate, Weichmacher 
    517.2958
    519.2955
    M+Ag+ C30H50Ag+ Squalene + Ag+
    605.3155  M+H+  C33H50P2O6H+  Ultranox 626 antioxidant, Bis (2,4-di-t-butylphenyl)Pentaerythritol Diphosphite 
    627.2974  M+Na+  C33H50P2O6Na+  Ultranox 626 antioxidant, Bis (2,4-di-t-butylphenyl)Pentaerythritol Diphosphite 
    637.3053  M+H+  C33H50P2O8H+  XR 2502 = oxidzed form of Ultranox 626, Bis (2,4-di-t-butylphenyl)Pentaerythritol Diphosphate 
    647.4587  M+H+  C42H63O3PH+  Irganox 168 (PE and PP stabilizer) Tri(2,4di-tert-butylphenyl)phoshate 
    659.2873  M+Na+  C33H50P2O8Na+  XR 2502 = oxidzed form of Ultranox 626, Bis (2,4-di-t-butylphenyl)Pentaerythritol Diphosphate 
    663.4536  M+H+  C42H63O4PH+  Oxidized form of irganox 168 (PE and PP stabilizer) Tri(2,4di-tert-butylphenyl)phoshate 
    669.4407  M+Na+  C42H63O3PNa+  Irganox 168 (PE and PP stabilizer) Tri(2,4di-tert-butylphenyl)phoshate 
    685.4356  M+Na+  C42H63O4PNa+  Oxidized form of irganox 168 (PE and PP stabilizer) Tri(2,4di-tert-butylphenyl)phoshat 

    M+H+ = protonated molecule   
    M+ = permanent cation 
    M-H- = deprotonated molecule

  • Spectra Quotation

    How to cite Mass Spectra in a Bachelor, Master or PhD thesis


    Usually the citation is devided into two parts, a general part where the instruments and methods used are named (i.e. general measurement conditions, e.g. GC conditions, coud be cited) and a specific part regarding the detailed results of a single measurement.


    Used instrumentation in the area of the Organic Chemistry MS-Department should be cited as follows in the general part:

    Please consider the printout of the spectra, where information on instrumentation and ionization method is given!


    • Mass spectra with direct inlet and electron ionization (EI) were measured on a Triplequad TSQ 7000 (Thermo-Finnigan-MAT, Bremen).
    • Mass spectra with GC-Inlet and electron ionization (EI) where measured on a Triplequad Quattro Micro GC (Waters-Micromass, Manchester,UK). The following separation column has been used as a GC column since 01/2016: Optima 5MS (30 m, ID 0.25 mm, 0.25 μm film thickness, corresponds to the separation properties of a HP5) Previous measurements were also made on HP5 equivalent columns.
    • Mass spectra with GC-Inlet and electron ionization (EI) where measured on a GC17A with QP5050 Single Quad Mass Spectrometer (Shimadzu Deutschland GmbH). (Device no longer in use.)
    • Mass spectra with GC-Inlet and electron ionization (EI) where measured on a Trace 1310 mit ISQ 7000 Single Quad Mass Spectrometer (Thermo Fisher Scientific). The following separation column has been used as a GC column since 11/2018: Thermo Gold TG-5HT (30 m, ID 0.25 mm, 0.1 μm film thickness, corresponds to the separation properties of a HP5)
    • Mass spectra (accurate masses) with GC-Inlet or push rod and electron ionization (EI) where measured on a Trace 1310 mit GC Exactive Orbitrap (Thermo Fisher Scientific). The following separation column has been used as a GC column since 11/2018: Thermo Gold TG-5SILMS (30 m, ID 0.25 mm, 0.25 μm film thickness, corresponds to the separation properties of a HP5)
    • Mass spectra with HPLC-separation and Elektrosprayionization (ESI) were measured on a 6110 (Agilent, Santa Clara CA, USA).
    • MALDI mass spectra were recorded on an Autoflex Speed (Bruker Daltonics, Bremen). A SmartBeamTM NdYAG-Laser with 355nm wavelength was used.
    • MALDI mass spectra were recorded on a  REFLEX IV (Bruker Daltonics, Bremen) (if measured in the Inorganich Chemistry MS-Department). A N2-Laser with 337nm wavelength and 3ns puls was used.
    • ESI mass spectra were recorded on a QUATTRO LCZ (Waters-Micromass, Manchester, UK) with nano-spray inlet. (Device no longer in use.)
    • ESI mass spectra were recorded on a  QUATTRO LCZ (Waters-Micromass, Manchester, UK) with TLC-MS coupling (home made, OC Münster). (Device no longer in use.)
    • ESI accurate masses were measured on a  MicroTof (Bruker Daltronics, Bremen) with loop injection. Mass calibration was performed using sodium formate cluster ions immediatley folled by the sample in a quasi internal calibration.
    • ESI mass spectra were recorded on an LTQ Orbitap LTQ XL (Thermo-Fisher Scientific, Bremen) with nano spray (alternatively HPLC, loop injection, syringe pumpe).
    • APCI mass spectra were recored on an LTQ Orbitap LTQ XL (Thermo-Fisher Scientific, Bremen) with loop injection.

    In the specific part, dealing with the compounds, results should be cited as follows:


    MS (EI direct inlet):
    m/z (%) = 306 (2) [M -.OCH3]+ , 294 (6) [M -HNCO].+ , 150 (12), 55 (87) [C4H7]+

    In this example different levels information can be noted:

    minimum citation: only m/z and abundance 150 (12)
    more detailed: m/z, abundance and sum formula 55 (87) [C4H7]+
    even more detailed: m/z, abundance and structure/fragmentation 306 (2) [M -.OCH3]+

    The radical character of fragmentations or of ions should be indicated.


    In general not all ions are cited, but as rough rule of thumb: all abundances >20%, and in addition all ions chacteristic for the compound, especially in the upper m/z range.

    MS-ESI (+):
    m/z (%) = 360 (100) [M+Na]+ , 338 (25) [M+H]+

    For complex isotope cluster you could cite as follows:


    MS-ESI (+)
    Isotope cluster arround m/z 402,5, intensity distribution matches the calculated distribution of [C20H20PdCl]+

    In this case the weighted mass average of the cluster shoud be cited, i.e. the stoichiometric mass of the ion. If especially relevant for structural characterization, the detailed abundances and masses of the pattern may be given, or a depicted spectrum in comparision with the calculated one.

    In cases where the separation of the isotope signals is not achieved (e.g. MALDI at higher masses) also the stoichoimetric m/z is cited (=centroid of the isotope cluster).

    MS-MALDI (+) linear or reflektor mode
    - non isotopically resolved spectra (mainly linear mode):
         m/z (centroid of the peak cluster) (%) = 2328,02 (100) [C120H198N20O24+Na]+
    - isotopically resolved spectra (mainly reflector mode):
        same as MS-ESI(+), in general the monoisotopic masses are given


    Meaurements of accurate masses are error-prone. In general an error of ±0.005 u or 5ppm is accepted.


    MS-EI-EM
    m/z = 260.1543 [M+.], calcd. for C20H20 260.1565.

    MS-ESI-EM
    m/z = 382.1405 [M+H+], calcd. for C20H20N3O5 = 382.1397.


    Please notice that for the calculation of accurate masses (especially with ESI) the mass of the electron(s) is relevant. Please consider this when calculating!

    The term "high resolution" (HR) should not be used, as actually an accurate mass meaurement is meant (whereas most spectra are in fact recorded at medium resolution)!


    In case of any doubt you should ask in the MS-Department! Never copy-paste information from older work - often there are instruments cited that are even not existing any more!