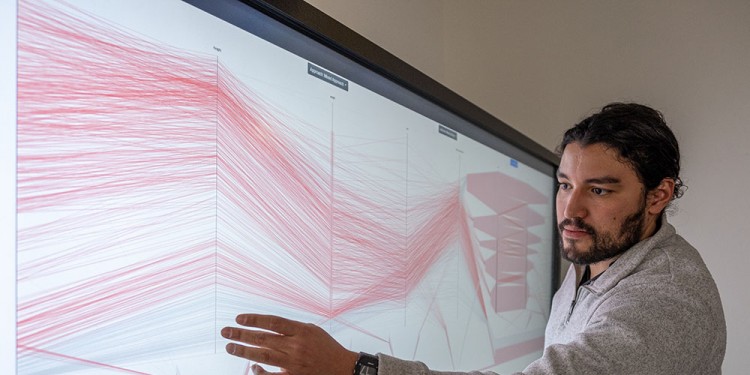
Visual analysis for medicine
Cancer, Alzheimer’s, diabetes or cardiovascular diseases are what are known as non-communicable diseases, which are responsible for the majority of deaths worldwide – in Germany, an estimated 91 percent of all deaths are the result of these diseases, and it is a rising trend. Epidemiologists have been studying the development and distribution of these epidemiological diseases, as well as the measures to combat them and what their social consequences are. Most experts know that there are very many factors responsible for the individual development of these diseases – but it is not always entirely clear which patterns or features are behind their origins and development.
“Over the past few years, comprehensive health studies have been carried out to discover the factors influencing the development and treatment of non-communicable diseases,” says Dr. José Matute. “As a result, enormous quantities of information and data are available which have to be interpreted and compared. Processing these data manually would be much too great a task, so computer-assisted methods are needed to create order and enable us to understand them.” In his dissertation at the Institute of Computer Science at the University of Münster, José Matute developed new methods of interactive visual data analysis in medicine. Taking an interdisciplinary approach in his work, the 30-year-old researcher, Honduran by birth, has spanned a bridge between the theoretical and informatics-related basics of visualization on the one hand, and medical image analysis – and, ultimately, its practical application – on the other.
“What’s special about this method is that it enables very large, heterogeneous medical data sets to be considered. Traditional methods, one single type of data is focused on mostly, which does not reflect the complexity of certain diseases and the courses they take,” says Prof. Lars Linsen, who heads the “Visualization and Graphics (VISIX)” working group at the Faculty of Computer Science and Mathematics and also supervised José Matute’s dissertation. Matute’s methods of visualization, Linsen adds, make it possible to obtain relevant information from large quantities of data and to present this information effectively and, for individual users, in an intuitively understandable way.
Methodological approach:
In his research, the computer scientist took into account both numerical values such as height, weight and age as well as so-called category features such as gender, blood group and degree of personal happiness. The sources for the data were, among others, medical reports, laboratory tests, interviews and questionnaires. The data sets were incorporated into the visualization methods and enabled factors to be recognized which can have a positive (preventative) or negative (risk) impact on the development of a non-communicable disease.
First of all, José Matute, a junior researcher, developed a fast, easy-to-use method of computing so-called “principal graphs” from scatter diagrams; this method makes it possible to determine the strength of a relationship between two numerical variables. The graphs are special curves which are used to describe the trends existing within the data and to derive certain features from them. In order to be able to handle more complex combinations of data types, José Matute extended two well-known methods for interactive analyses of numerical data to heterogeneous data sets. These methods are able to take into account several data types in any analysis and thus provide structured guidance for the user in dealing with visual analytical tasks. “By means of these new methods we can observe sub-populations – in other words, certain sections of the population who display a common feature – and then try to recognize the occurrence of preventative factors for diseases,” explains Prof. Henry Völzke, who holds the Chair of Clinical Epidemiology at the Institute of Community Medicine (Greifswald University Clinic). He provided José Matute with the data for his analysis and contributed his expertise in the field of epidemiology.
In order to test the visual methods, José Matute developed a number of applications – for the planning of aorta operations, for the two-dimensional visualization of complex blood vessel structures, and for the analysis of kidney segmentations. “I found that the visual methods for the areas tested are promising. It is a great advantage to be able to make a fast and efficient analysis of large data sets for the purpose of obtaining medical information. The practical applicability is enormous,” says José Matute.
Kathrin Kottke
