The Whole Universe in Münster

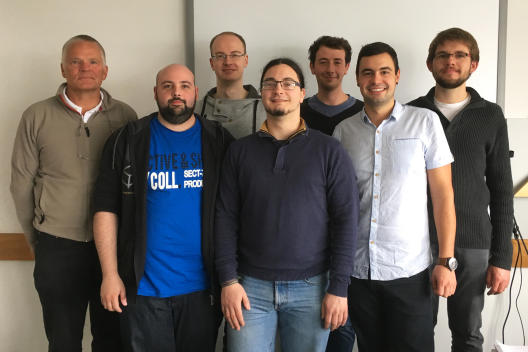
A group of students coached by Tobias Brix and Aaron Scherzinger, who are members of the research group VisCG led by Prof. Dr. Klaus Hinrichs PhD, won the Scientific Visualization Contest – or SciVis Contest, for short. They have seen off a strong international competition. The prize was presented during the annual Visualization Conference held by the Institute of Electrical and Electronics Engineers (IEEE Vis), the largest such conference in the world.
In the contest, which is held every year, scientists perform innovative research into visualizations relating to current scientific problems. In doing so, they develop novel approaches to create insightful images. This year, applicants were required to visualize nothing less than the beginnings of the universe.

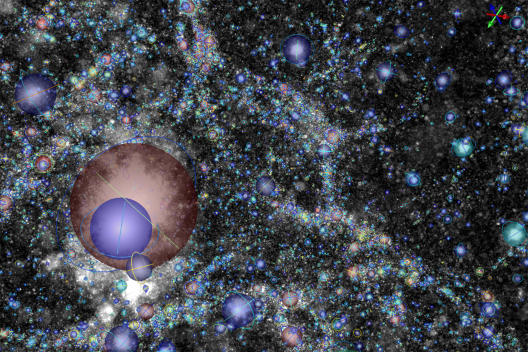
In a project seminar, the students and scientists set to work on data sets of cosmological simulations which had been created at Stanford University. Physicists had simulated the movement of so-called dark matter – which is matter that only exists hypothetically, but is considered to account for a considerable part of the universe. “We have now visualized what can’t actually be seen,” says Tobias Brix.
With the developed application, the dark matter in the universe can now be viewed from all sides. With just a few clicks the user can navigate through the data and zoom in on so-called halos. These are local clusters of dark matter which might house galaxies such as the Milky Way. Using the program, users can also accurately track halos as well as individual particles and their development over time. It is also possible to highlight specific structures such as particularly active areas in which several halos merge together into a larger structure.
The Münster group’s entry turned out to be the favourite of many for the SciVis Contest reviewers. The jury explained its decision thus: “The solution addressed to various extents all tasks, a major accomplishment given the broad nature of the problem. It presented an overall software infrastructure with a very usable workflow.” Members of the jury showed strong interest in using the system for their daily work. One of the reviewers even said that up to then he had never seen a cosmological visualization application that feature rich. “During the project we worked very closely with a physicist from Münster University,” says Tobias Brix, “and he was able to tell us what information our software should provide to domain experts to enable them to successfully pursue the scientific questions they are working on.”
Computer scientists from the VisCG research group in Münster had already been successful in the SciVis Contest before. In 2010 they won the first prize for a visualization software enabling physicians to plan access to a brain tumour before an operation. Two years later scientists and students achieved the second prize with a visualization of the behaviour of so-called ferroelectric substances which change the direction of their polarization under the influence of electric fields. The basis for the work of all three contributions was the software Voreen, which was developed primarily for biomedical visualization within the Collaborative Research Centre 656 "Molecular Cardiovascular Imaging". The software can be used, among other things, for visualizing particularly large data sets. The first version of the program dates back to 2005, and since then it has been constantly extended for new applications. Research groups at Münster University also use the program, often working together with the VisCG computer scientists in cooperative research projects. Medical physicists working within the Cells-in-Motion Cluster of Excellence, for example, have been able to use the software to visualize the blood flow in the largest blood vessels in the body.

