
High resolution images of volcanic areas
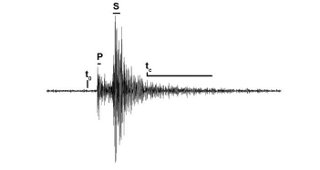
The main problem when dealing with high-frequency volcanic seismic recordings is that we are rarely able to discriminate phases other than P- (compressional) and, with much more difficulty, S-waves (transverse) from "random-like" phases acting at later lapse times (Figure 1). This means that we cannot exactly relate a seismic phase to a given interface at depth, since the phases themselves appear randomly during the entire seismogram. In addition, the ray-approximation breaks in a highly heterogeneous region, due to strong multiple scattering, which a large redistribution of the body-wave energy at later times with respect to the source nucleation time.
Volcano seismologists are therefore more accustomed than other seismologists to the statistical study of seismic energy as well as to the break of the ray approximation. They develop tomographic techniques and statistical models which are based on the dispersion of seismic energy in highly scattering media (Sato and Fehler, 2012). These models do not exactly relate this energy to deterministic interfaces, but describe the entire medium by using probabilities, much like in nuclear physics
"Coda waves", the tale portion of a high frequency seismic recording (Figure 1), are the main data available to seismologists to relate the "random" energy at a given lapse-time from the source nucleation to the region that produced it. By using the coda of a single source-station pair one may define the loss of the direct wave energy and relate it to the theoretical ray-path of the body wave (Sato and Fehler, 2012). This allows depicting the "quality" of the medium (quality factor, Q) in "attenuation tomography", where structures like fluids and magma will present low quality, due to their increased temperature and/or larger scattering power (red-orange, Figures 2 and 3).
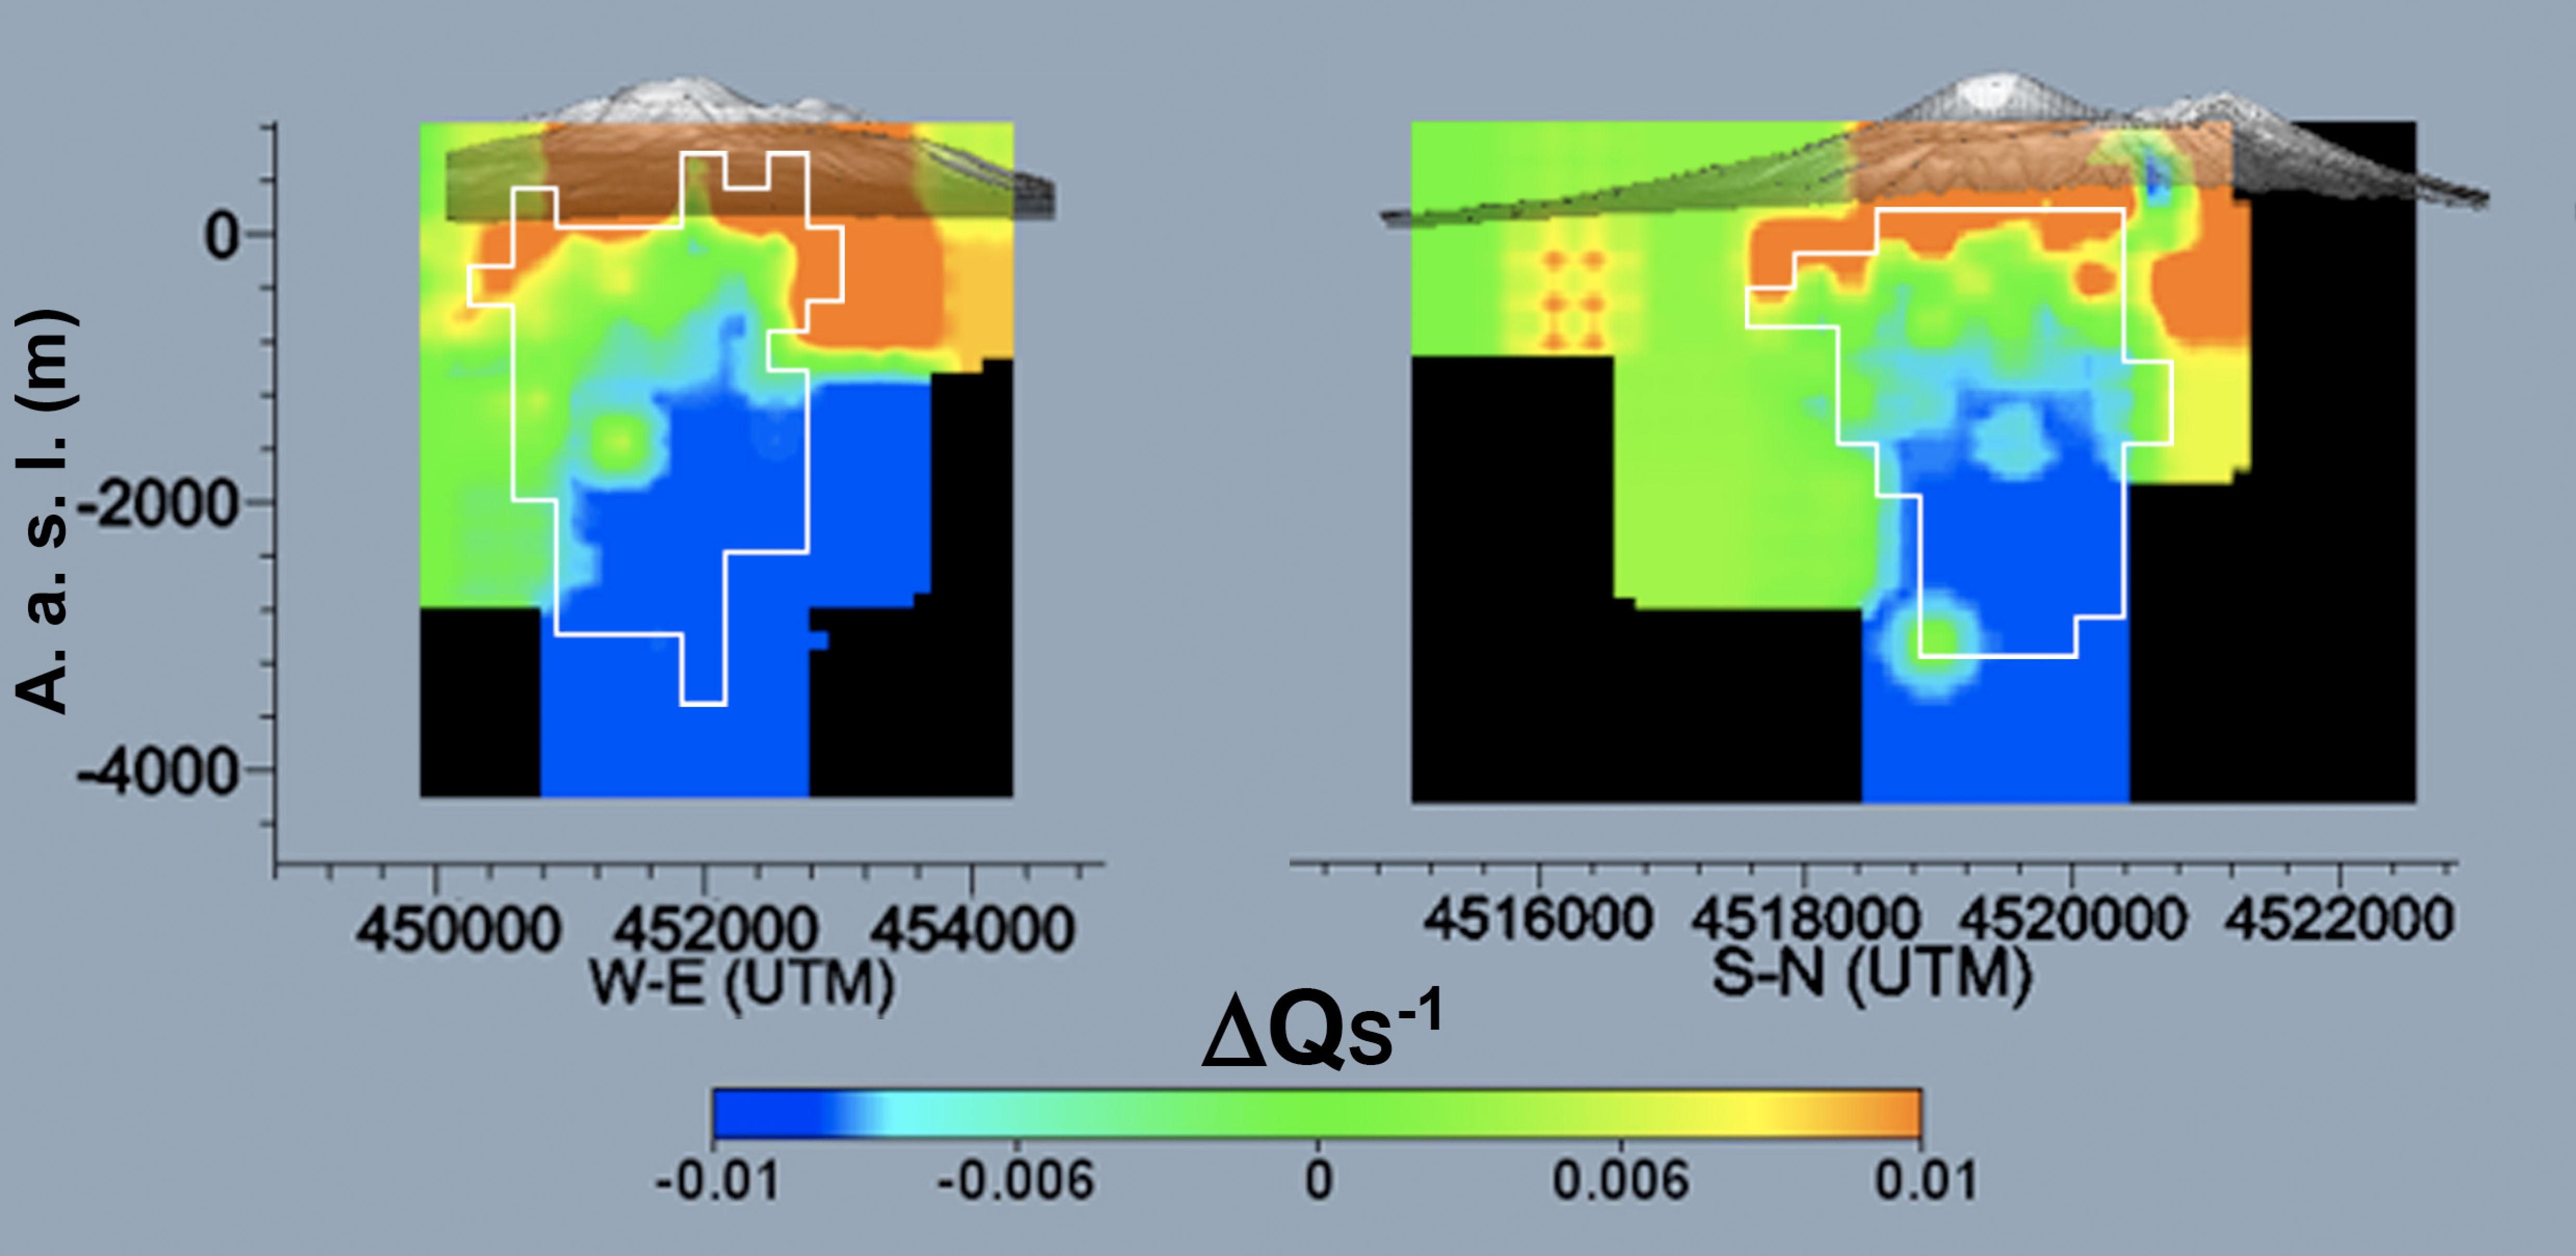
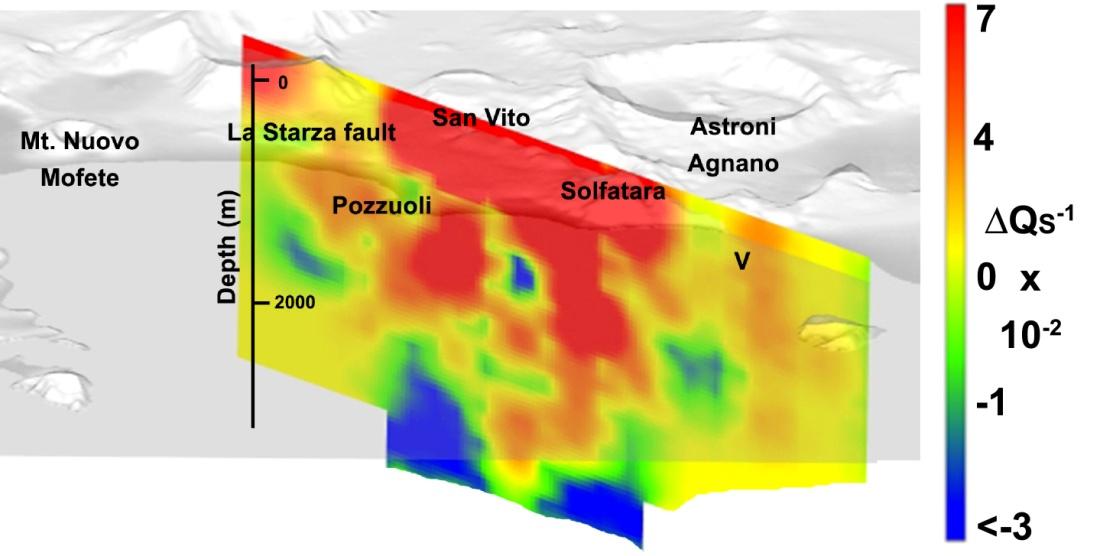
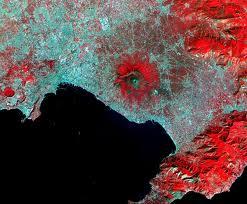
Mt. Vesuvius and Campi Flegrei caldera (Figures 2 and 3), Naples, Italy, are dormant volcanoes that present continuous seismicity which shades light on their feeding systems, mostly comprised of magmatic fluids and gasses (Del Pezzo et al., 2006; De Siena et al., 2008, 2010). The urban zone of Naples (3 Mil. inhabitants) is built near, and, in some parts, on these volcanoes. To know where fluids and melt are means to know where a future eruption may happen. Imaging a volcano means therefore a large commitment to the community which is leaving near to it: a scientific error may cause large life and economical losses (Figure 4). Nevertheless, a simple image of where the energy is lost is not sufficient to understand if a "red" anomaly is, e.g., a magma chamber. Being a volcano seismologist means a continuous interaction with the geology and mineralogy departments at the aim of hunting feeding systems, magmatic/fluid chambers, and sills under volcanoes.
Coda-waves may be used without any relation to the ray-path in "scattering tomography", which requires the synthetic modeling of seismic energy, contained in the energy envelope (mean square of the seismogram). Magma (melt), fluids, gasses, faults all represent scattering bodies characterized by different scattering power: by connecting the time and energy of different phases in the coda to the location from where they come, scattering tomography allows to shade light on them, even if they are far from the source-station theoretical ray-path (Asano et al., 2004). Scattering tomography is the first step towards full-waveform tomography, a technique which tries to create a synthetic model of the entire waveform to be compared with the real waveforms, allowing more precise estimates of velocity and attenuation in the Earth (Fichtner, 2010). This technique suffers from the complex multiple scattering mechanisms acting in volcanoes, as well as the proximity of the source to the structures we want to image.
The basic step for full waveform tomography is the modeling of the seismic envelope. This can be achieved by Monte Carlo modeling, where, like in nuclear physics, the source emits (elastic!) particles that propagate following given probabilities into the high scattering volcanic medium. We can therefore derive the statistical characteristics of the velocity fluctuations (like the correlation length) and build synthetic envelopes to be compared with real data (De Siena et al., 2013). These frequency-dependent envelopes show that a volcanic medium still presents deterministic effects which can be translated in structures trapping seismic energy (Figure 5), boundaries that affect the entire coda wave field (usually assumed as homogeneous at late lapse-times). The last consequence is the development of tomographic techniques based on the measurement and synthetic model of seismic energy, which can account for the complex source, trapping, interference, and resonance effect which constitute the volcanic seismogram.