D" anisotropy


As part of the CREEP project, at the Institut für Geophysik in Münster we use seismology to probe anisotropy and deformation in the D" region (the lowest few hundred kilometers of the Earth’s mantle, figure 1).
This region seems to have a fundamental role in the geodynamics of our planet. Global tomographic image, at those depth, show fast and slow regions which have been associated to descending of slabs and uprising of plumes, as depicted in the cartoon of figure 1. These structures are most likely associated at flow in the deep mantle and probing seismic anisotropy could help us to understand the mantle rheology and dynamics. Moreover, a phase transition from perovskite (bridgmanite) to post-perovskite is expected to be the seismic marker of the D" discontinuity. Due to the different rheological behavior of ppv respect to pv, anisotropy in ppv is a good candidate to explain the observed seismic anisotropy in the around the core mantle boundary.

Figure 1. Cartoon illustrating different scenarios for D". Subducting slab, rising plumes and phase transition from pv to ppv are expected at D" depth. Due to mantle mantle flow, alignment of ppv crystals could cause lattice preferred orientation and seismic anisotropy as illustrated on the top right. Showed are also the PdP reflected waves that we use to study the anisotropy (same for SdS).
© Institut fuer Geophysik

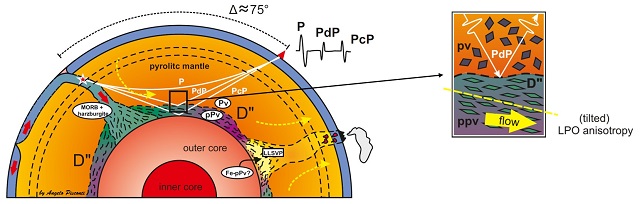
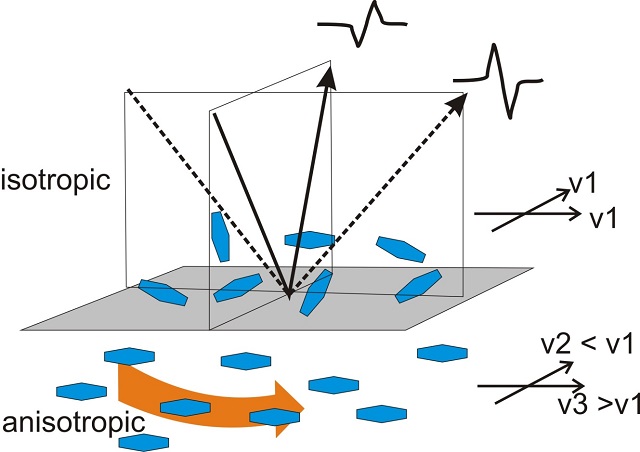
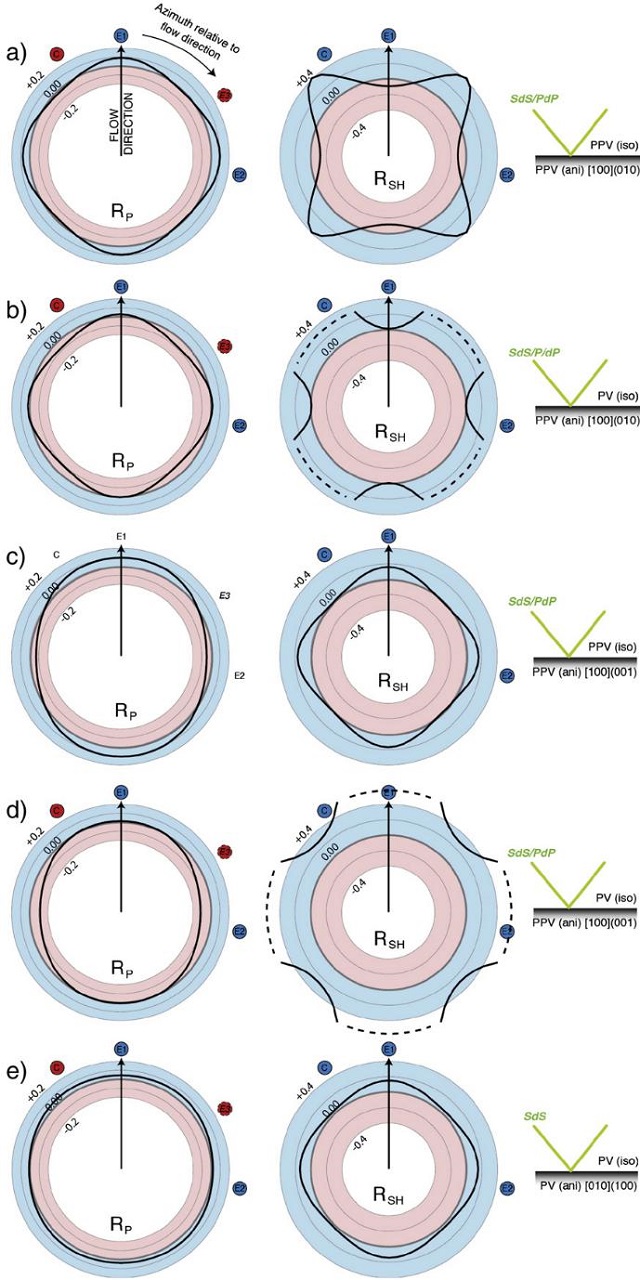
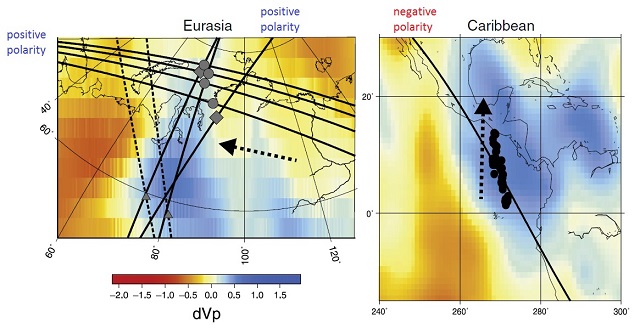
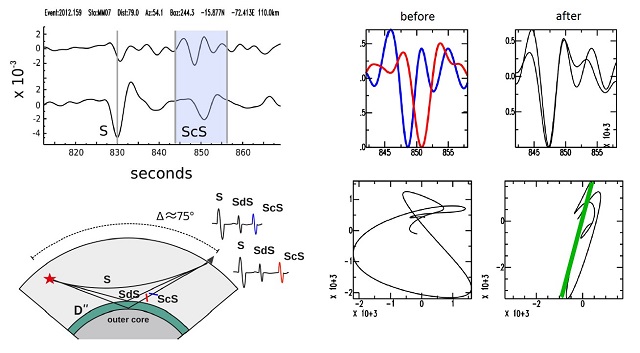
By definition, in anisotropic media the seismic velocity changes with the direction of travelling. If we consider a discontinuity marking the transition from isotropic to anisotropic media, the impedance contrast across such discontinuity could be azimuthal dependent. If we assume such a patter for the D" region, being the reflection coefficient depending on the impedance contrast, we expect to see polarity variation of the reflected phases (PdP and SdS). To investigate seismic anisotropy, we look then at the polarity of waves reflected from the top of the D" (figure 2 and 3).

Figure 2. Example showing polarity variation of PdP phases respect to flow direction (indicated by black dashed arrows). Beneath Eurasia the polarity is always positive, while in Caribbean negative polarities have been observed
© Institut fuer Geophysik

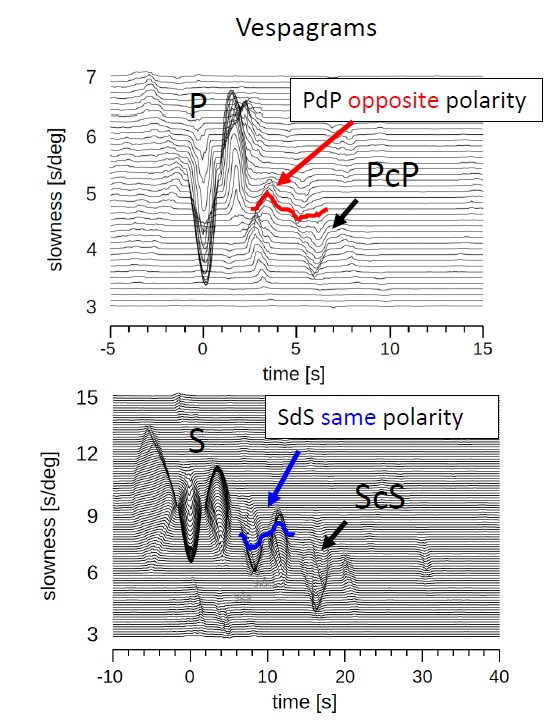
Due to the small impedance contrast (also depending on the incidence angle on the top of the D’’) the amplitude of the PdP(SdS) phases can be quite small in single station seismograms. This is why we use array methods where we stack the seismograms, recorded at a same array, in order to better focus the energy and increase the signal noise ratio. The output of this procedure is called vespagram (click here for more detailed information on vespa process).
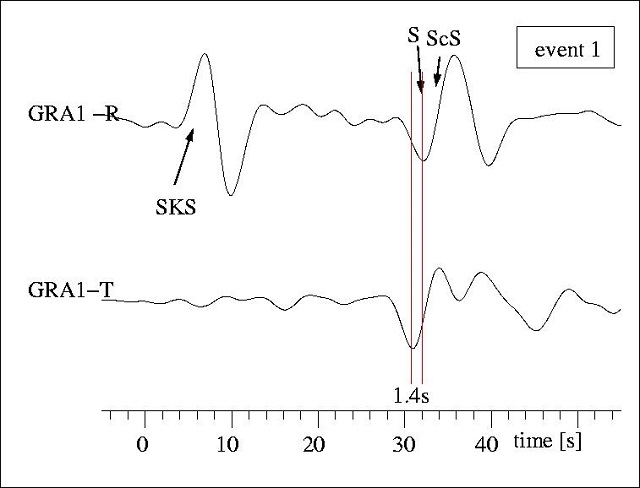
Example of vespagrams showing opposite polarity for the PdP phase (respect to P and PcP) can be found in figure 3, whereas SdS exhibits normal polarity, being the same as the S and ScS.

Figure 3. Vespagrams showing D'' reflected phases (PdP and SdS) polatiry studies. The slowness of such phases is between the direct P(S) and the outer core reflected PcP(ScS) phase. Opposite polarity for PdP and same polarity for SdS is found in this case. Data are from South American earthquake recorded at the Morocco array, with epicentral distance of ≈ 75°. Bounce points in the lowermost mantle for this dataset are in the Central Atlantic Ocean.
© Institut fuer Geophysik
Figure 4. Example showing an S-ScS differential splitting measurement on woveform recording from South American earthquake at one of the Morocco’s array station.  On the top left the considered ScS window in the analysis. Bottom left showing an ScS splitting occurring in the D". On the right side, the fast (blue) and slow (red) waves before and after the splitting estimation. The particle motion became linear after the splitting operator application as also marked by the green line. The ScS were already “corrected” for the receiver side and for the source side anisotropy.
© Institut fuer Geophysik

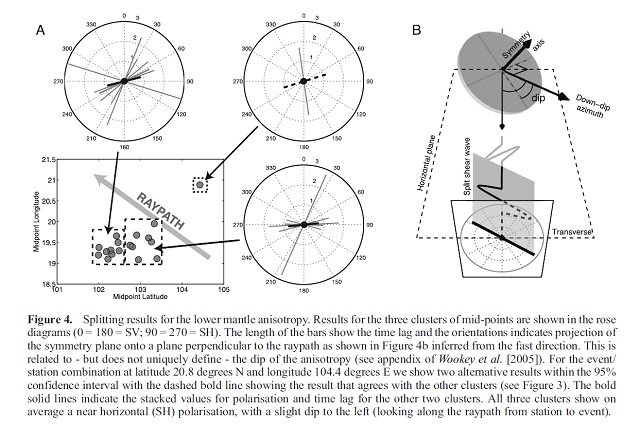
By azimuthally sampling a given region and using both methods briefly described above, we expect to collect a dataset of seismic anisotropy measurements. This dataset needs to be then compared with anisotropic models for mineral assemblages expected at D" conditions, as LPO in post-perovskite and ferropericlase, for different slip planes, phase proportions, texture and alignment. This could give us precious information on microstructures and rheology at the bottom of the mantle, perhaps helping us to provide the link between micro and macro scales of deforming Earth materials.


Further reading:

  • Thomas C, Wookey J, Brodholt J, Fieseler T (2011) Anisotropy as cause for polarity reversals of D′ reflections. Earth and Planetary Science Letters, 307 (3-4), p. 369-376.
  • Nowacki, A., Wookey, J., & Kendall, J. M., 2010. Deformation of the lowermost mantle from seismic anisotropy, Nature, 467(7319), 1091–1095.


D" Anisotropy


Several studies carried out by seismologists from the Münster group investigate the anisotropy in D". Earlier work tested anisotropy beneath Siberia and Southeast Asia. Evidence for anisotropy in the D" region was found in those places and in 2007 we tested the possibility of inclined anisotropy. These manuscripts used shear wave splitting measurements in collaboration with the Bristol (formerly Leeds) group.
Recently during a MSc thesis Philipp Prasse re-analysed data from the west-coat of the US for Pacific anisotropy. A publication is in preparation.
The example below is a seismogram from the Gräfenberg array in Germany. Clear splitting can be seen and comparison with modelling also shows the presence of the D" reflection in the data (see Thomas and Kendall, 2002) and below that the results for Southeast Asia.

© Institut fuer Geophysik

Following these observations, the polarities of reflections from the D" region were used to investigate whether or not anisotropy could be present in D". We used reflections from P and S-waves in multiple azimuths to test the possibility of directional dependence of the reflections coefficient. It turned out that the polarity variation observed beneath the Caribbean and Siberia can be explained by aligned post-perovskite (see also D" reflection and post-perovskite project).

© Institut fuer Geophysik

This possible setup shows why the reflection coefficient changes when one of the two layers consists of aligned minerals. It is necessary, however, to use both P and S- waves simultaneously to distinguish between models (see Thomas et al., 2011).
The figure below shows the variation of reflection coefficient modelled for two different cases (for more please see Thomas et al., 2011). The P-wave reflection coefficient varies in a similar way in both cases, however, only for the case with an anisotropic and aligned post-perovskite we find that all S-wave reflection coefficients are positive in all directions as observed in all data examples we found so far in those regions. The project of Angelo Pisconti continues with investigating this approach and Morvarid Saki extends it to upper mantle discontinuities.

© Institut fuer Geophysik

For more information please see


Thomas, Ch. and J-M. Kendall. The lowermost mantle beneath northern Asia: (2) Evidence of lower--mantle anisotropy, Geophys. J. Int., 151, 296-308, 2002

Thomas, C., J. Wookey and M.R. Simpson, D” Anisotropy beneath Southeast Asia, Geophys. Res. Lett., 4, L04301, doi:10.1029/2006GL028965, 2007.

Thomas, C., J. Wookey, J.P. Brodholt, T. Fieseler, Anisotropy as cause for polarity reversals of D" reflections, Earth Planet. Sci Lett, 307, 369-376, 2011.

Creasy, N., Pisconti, A., Long, M.D., Thomas, C., Wookey, J., 2019. Constraining lowermost mantle anisotropy with body waves: A synthetic modeling study, GJI, doi: https://doi.org/10.1093/gji/ggz049.

Pisconti, A., Thomas, C., Wookey, J., 2019. Constraining D" anisotropy with reflections and splitting. JGR, DOI: 10.1029/2018JB016993.

Wolf, J., Creasy, N, Pisconti, A., Long, MD, Thomas, C. 2019. An investigation of seismic anisotropy in the lowermost mantle beneath Iceland, Geophys. J. Int., S152-S166, doi.org/10.1093/gji/ggz312

Creasy, N., Pisconti, A. Long, M., Thomas, C., 2021. Modeling of seismic anisotropy observations reveals plausible lowermost mantle flow directions beneath Siberia, Geochemistry, Geophysics, Geosystems, 22, doi.org/10.1029/2021GC009924.

Pisconti, A., Creasy, N., Wookey, J., Long, M., Thomas, C., 2022. Mineralogy, fabric, and deformation domains in D" across the southwestern border of the African LLSVP, in press, Geophys. J. Int., doi.org/10.1093/gji/ggac359