
Anisotropy in the MTZ
Seismic anisotropy, the intrinsic property of elastic materials that produces the directional dependence of seismic wave speed and polarization has been observed in many regions of the Earth's interior including the lower crust, upper mantle, D" layer and the inner core. Observation of seismic anisotropy in the mid-mantle depths (transition zone and upper part of the lower mantle) is not well understood with some studies discussing evidence for little to no anisotropy, globally present anisotropy or anisotropy limited in the upper mantle transition zone. However, evidence for the presence of seismic anisotropy in this region is mounting from normal modes as well as surface wave studies.
Olivine, the most dominant mineral in the upper mantle exhibits a strong intrinsic anisotropy. Anisotropic minerals in the presence of plastic deformation related to mantle flows can potentially develop a Crystallographic Preferred Orientation (CPO) that gives rise to seismic anisotropy. Due to the direct link between the CPO of mantle minerals and mantle deformation, the study of seismic anisotropy can be used as a marker for the style of mantle flow in different tectonic regions which provides valuable information for our understanding of dynamic processes at depth.
In order to investigate the anisotropy in the MTZ we look at the polarity and amplitude of the PP and SS precursors (relative to PP and SS) to establish whether there is any dependence on travel direction of the seismic waves beneath the Northern Atlantic using different source-receiver combinations with crossing ray paths (Figure 1.a).
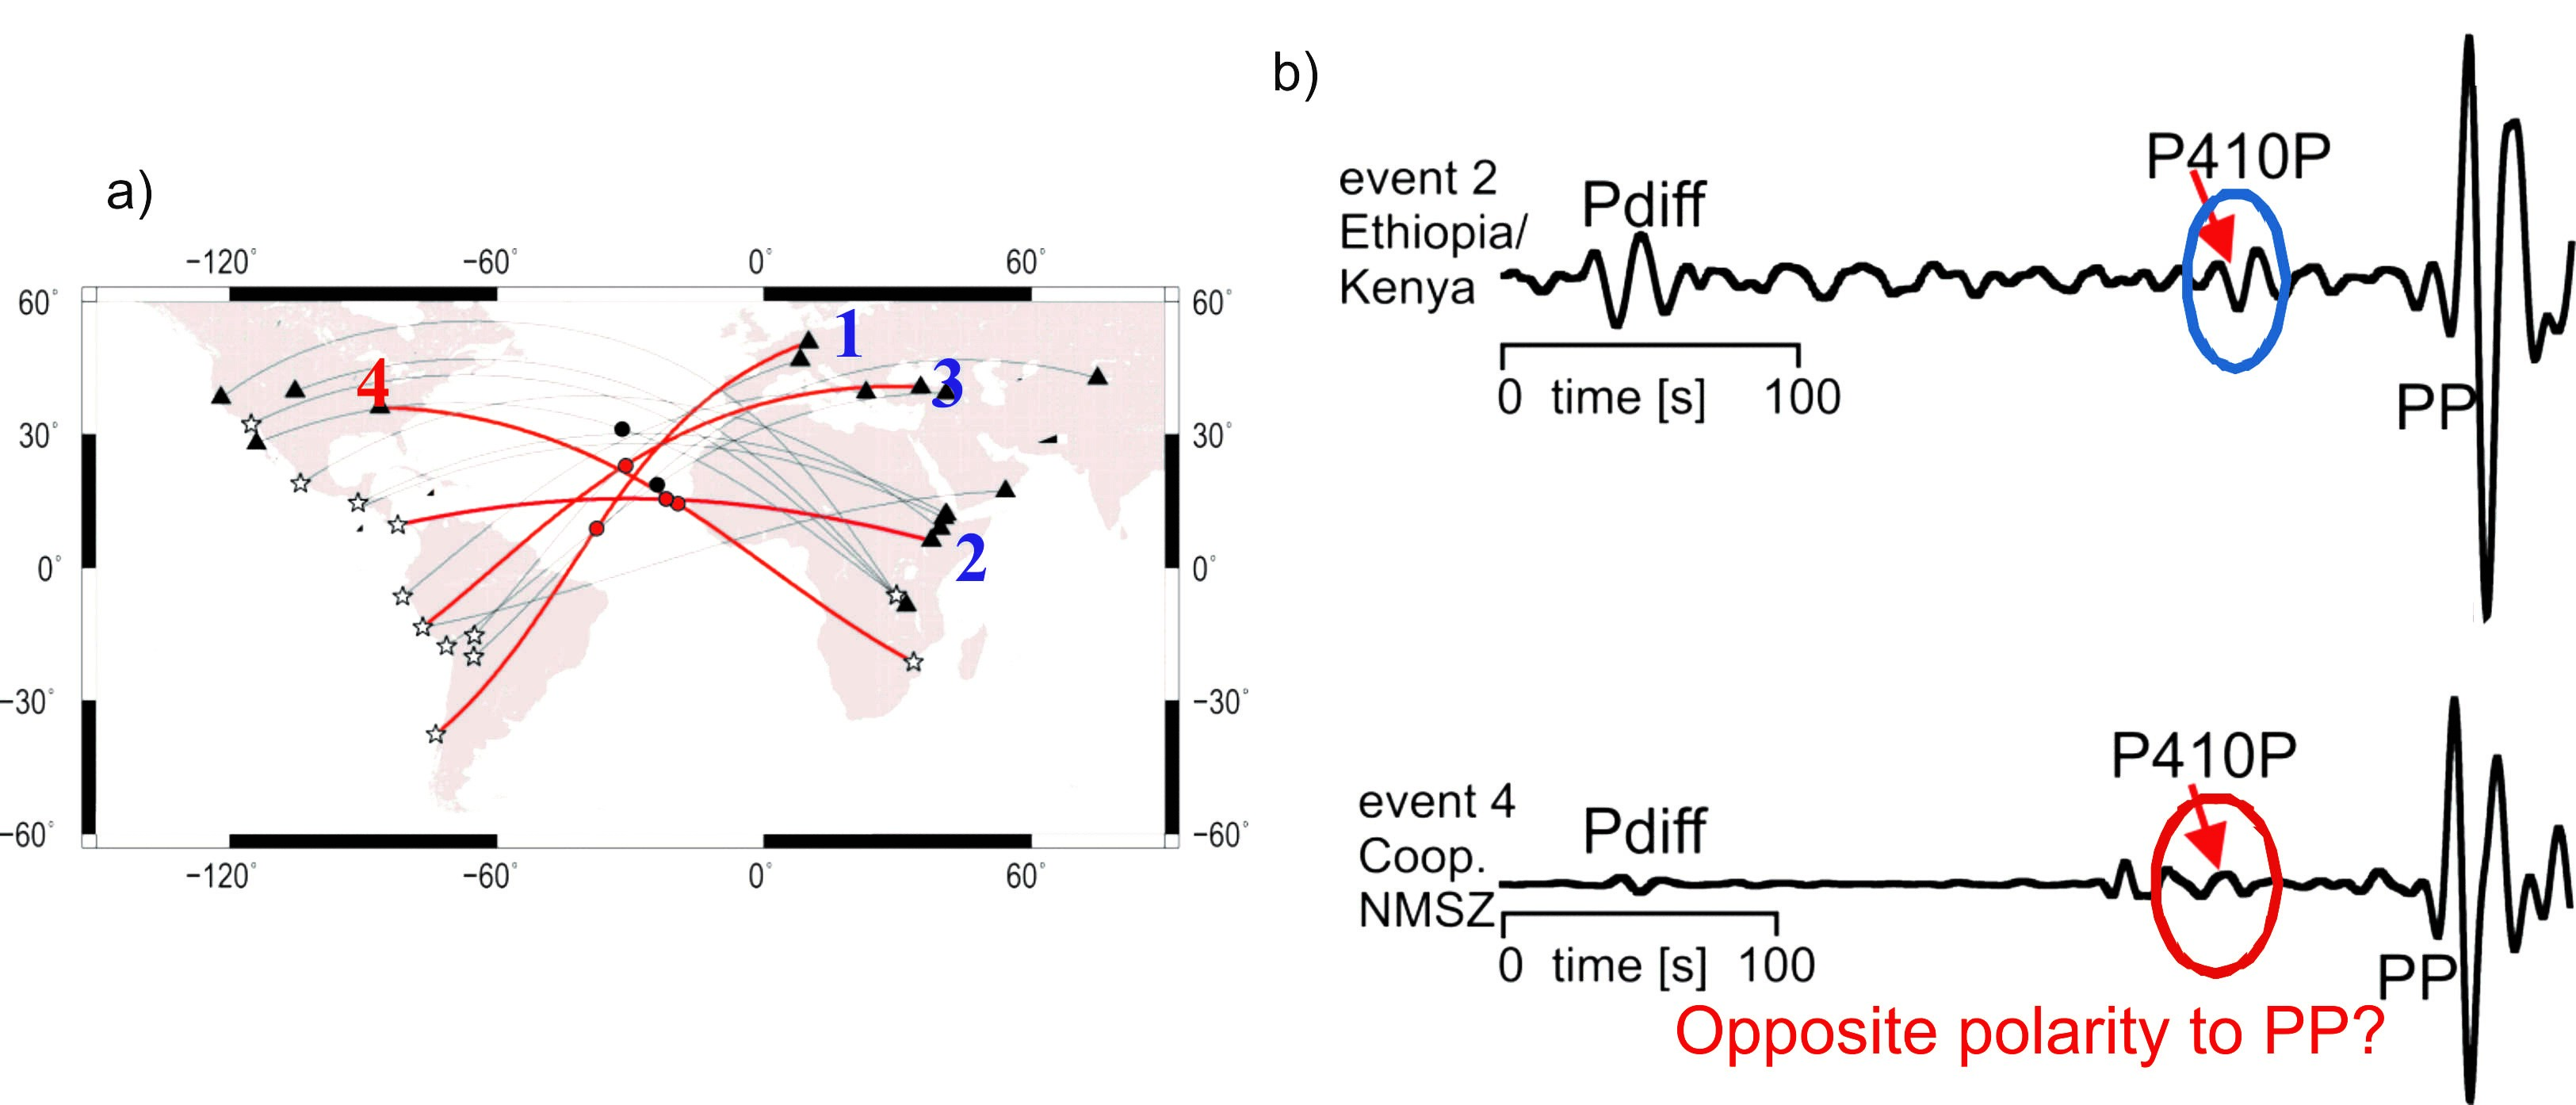
Figure 1: Example of some possible source-receiver combinations with reflection points of PP and SS waves beneath the Atlantic that can be used to study the seismic anisotropy in the MTZ (a). Triangles represent arrays, stars show locations of earthquakes. b) Example of an event with the similar polarity behaviour of P410P wave and PP wave (top figure). The source-receiver combination corresponding to this event represents a S-W propagation path. The bottom figure shows an example of a possible reversed polarity of P410P wave compared to the PP wave. The propagation path is crossing the travel path of event 2 in SE-NW direction.
Furthermore, in order to investigate the other possible processes to change the polarity of the reflected signals from the 410 km discontinuity, anisotropy modelling of the reflection coefficients of PP and SS waves reflected off an olivine-wadsleyite boundary have been done (Figure 2). We tested the capability of different deformation styles as well as the level of deformation on the reflection coefficient and with that on amplitude and polarity of the reflected waves from the top boundary of the mantle transition zone. The results of this study may provide a diagnostic tool for determining the deformation mechanism occurring at mantle transition zone boundaries.
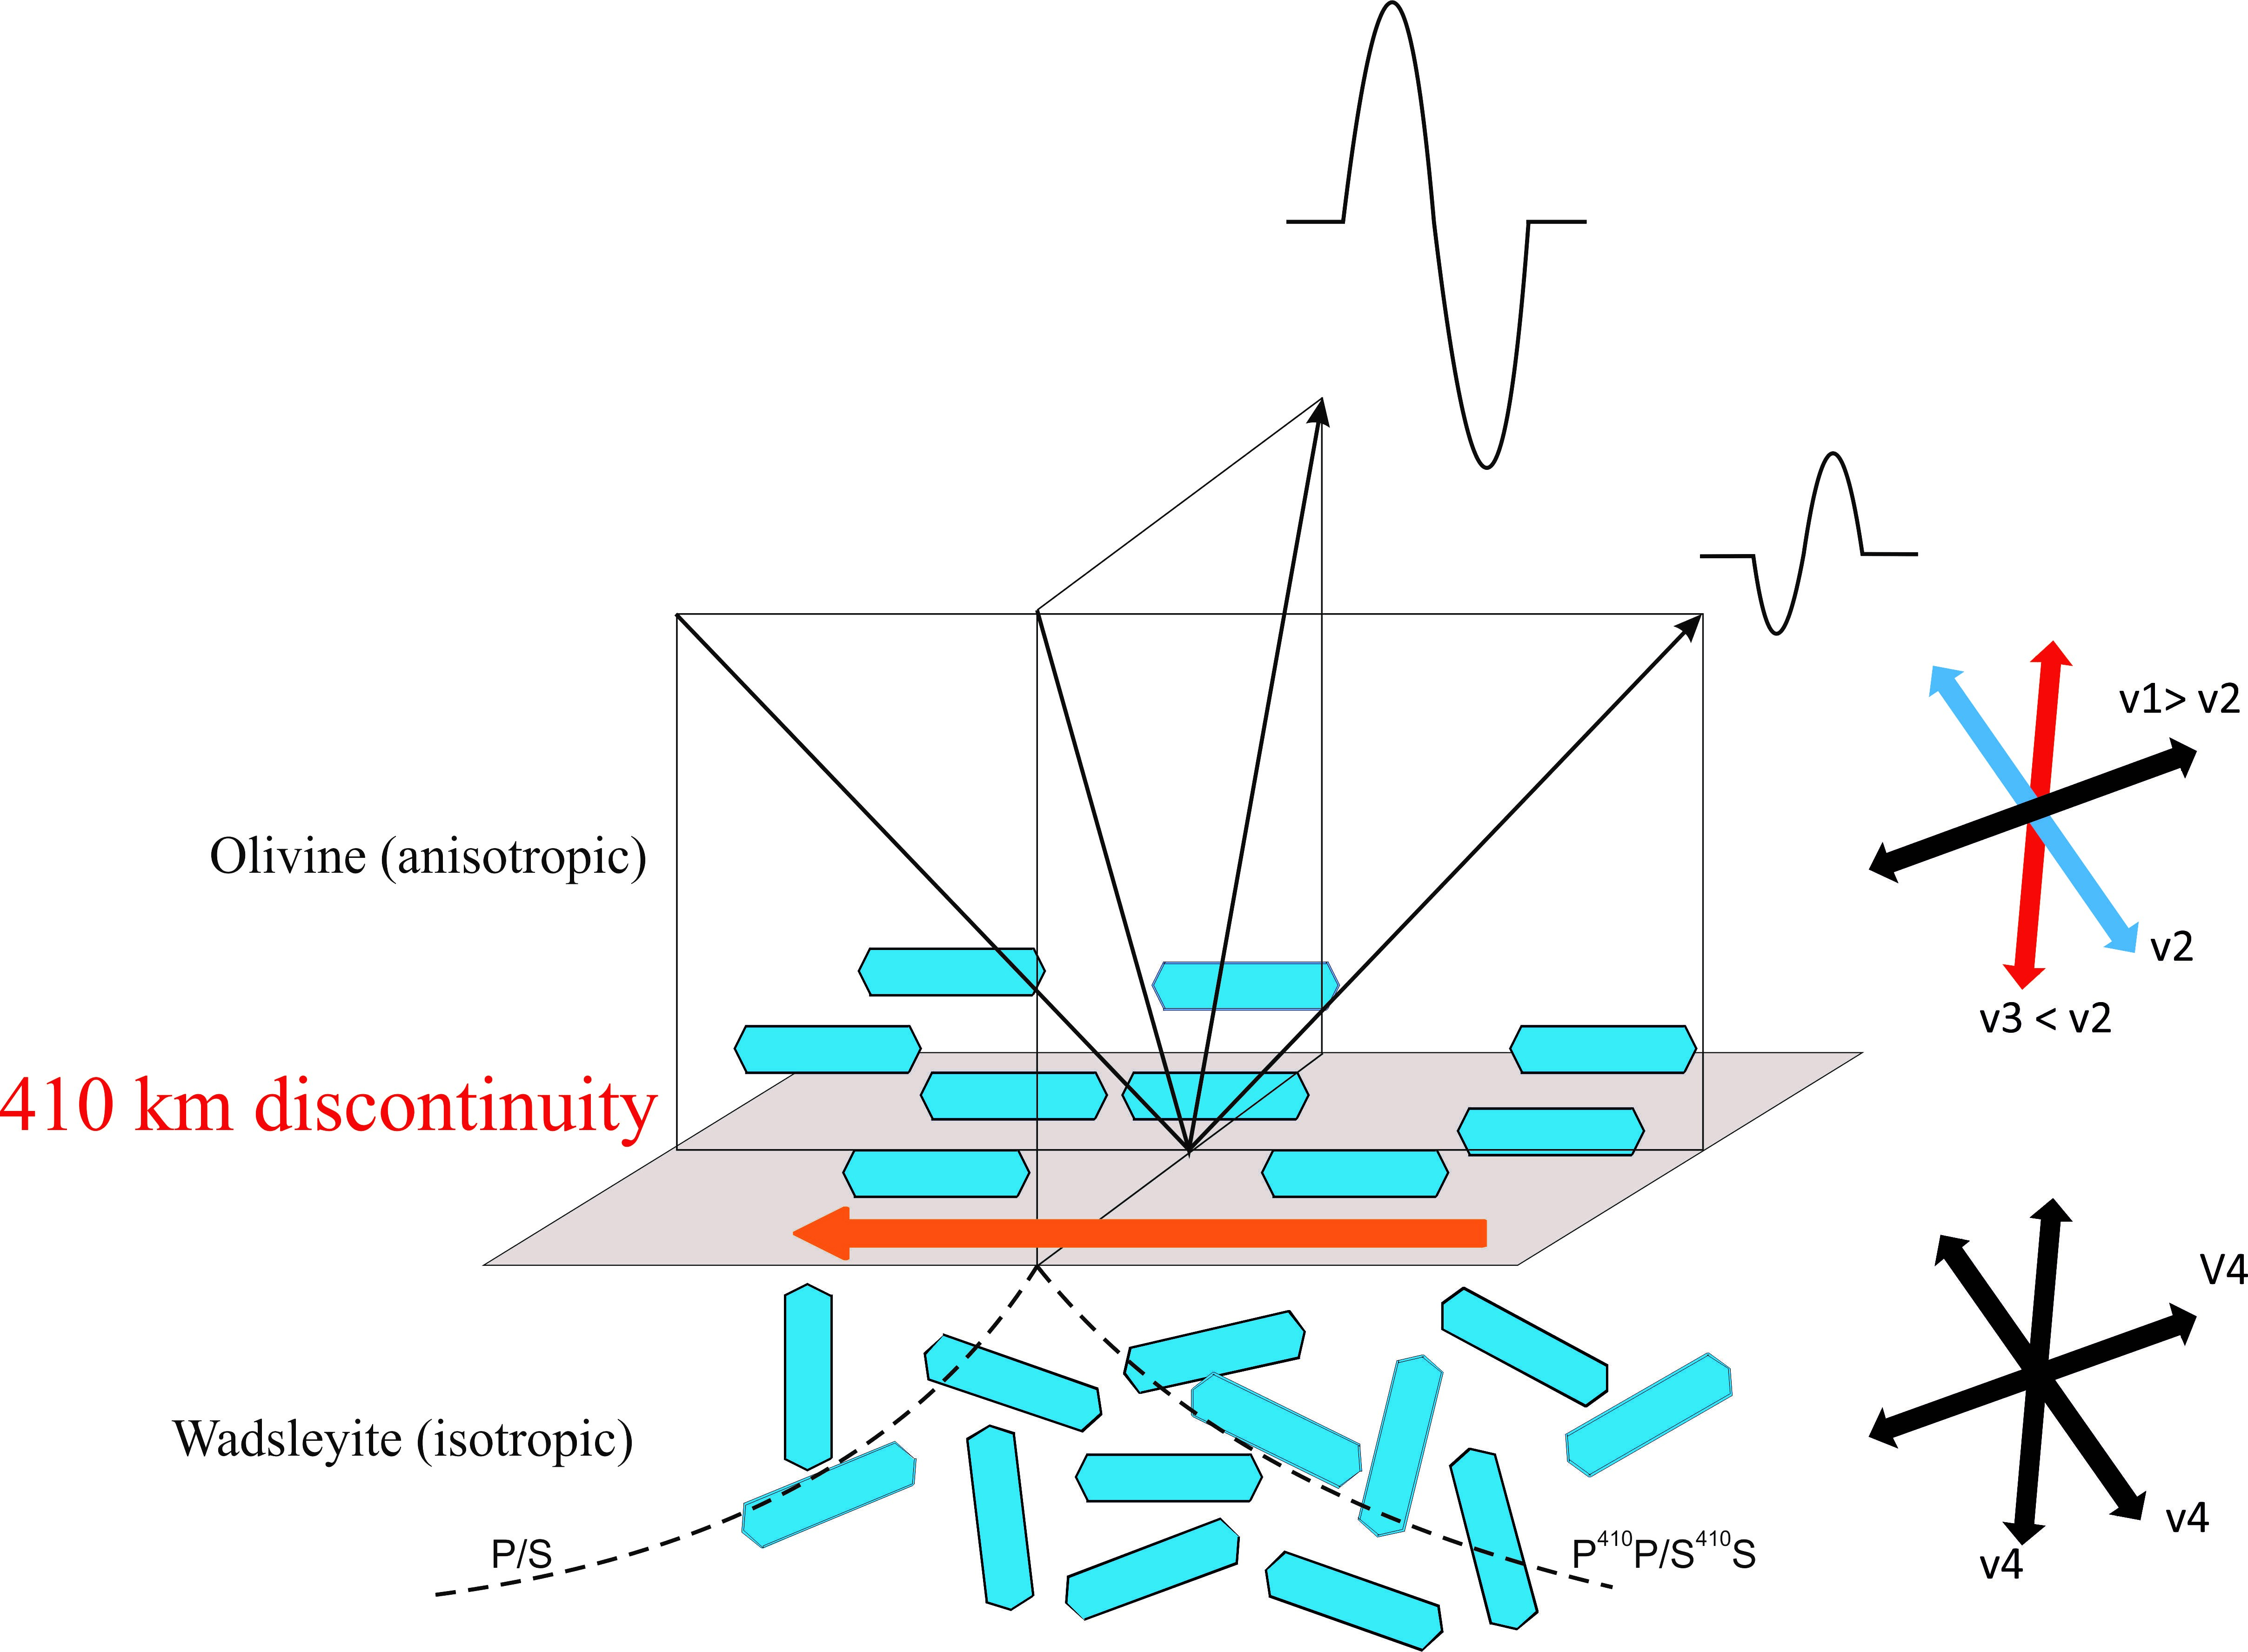
Figure 2: Schematic cartoon illustrating the effect of aligned minerals on the amplitude and polarity of the observed signals in different directions, reflected off the 410 discontinuity. This case is showing an anisotropic layer of olivine which produces variable velocities in different directions (v1, v2 and v3), above an isotropic layer of wadsleyite with the same velocity in all directions (v4). The differences in velocity in different directions in the layer above give rise to variable amplitudes and perhaps polarities (indicated by the two waveforms).The dashed line shows the P410P/S410S path. The orange arrow shows the direction of deformation/shear that aligns the crystals above the 410 km discontinuity.
Relevant Papers
Saki, M., Thomas, C., Merkel, S., and Wookey, J. Detecting seismic anisotropy across the 410 km discontinuity through polarity and amplitude variations of the underside reflections. To be submitted Feb 2017.