We are using a wide variety of techniques, including molecular biology, protein and nucleic acid biochemical techniques, FPLC and HPLC chromatography, absorption, fluorescence and circular dichroism spectroscopy, steady-state and pre-steady-state kinetics, and time-resolved single-molecule fluorescence spectroscopy (confocal and total internal reflection microscopy).
Fluorescence resonance energy transfer (Förster transfer)
Fluorescence resonance energy transfer (FRET) is a transfer of energy from a donor fluorophore to an acceptor fluorophore as a result of a dipolar coupling of their transition dipoles (Förster mechanism). Due to its distance dependence, FRET has been used extensively for distance mapping.
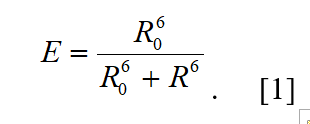
The energy transfer efficiency, E, depends on the inverse sixth power of the distance, R, separating the donor and acceptor fluorophores:
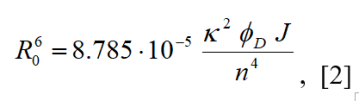
R0 is the Förster distance or critical transfer distance, which is characteristic of the donor-acceptor pair used. For R = R0, the FRET efficiency is 0.5. The Förster distance, R0, in Å, can be determined from the spectral properties of the donor and acceptor fluorophores using eq. [2],
where κ2 is the orientation factor, φD the quantum yield of donor fluorescence, J is the overlap integral, and n is the refractive index of the medium between the donor and acceptor fluorophores. The refractive index of aqueous solutions is approximately 1.33. The orientation factor, κ2, assumes a value of 2/3 if the donor and acceptor fluorophores exhibit unrestricted rotational motion.
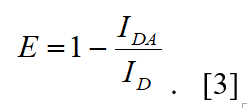
From steady-state fluorescence emission spectra of the sample, the FRET efficiency can be determined from the fluorescence intensity of the donor fluorophore in the absence, ID, and in the presence of the acceptor, IDA:
FRET is unique with respect to the experimentally accessible distance range (1 – 10 nm), which comprises typical intra-molecular distances of proteins and nucleic acids.
Single molecule FRET
Significant improvements with respect to the sensitivity of fluorescence detection led to the first observation of a single fluorophore in solution in the 1990s(4). Since then, a variety of different experimental approaches have been pursued to study fluorescence from single molecules (for a review see (5)). Single-molecule FRET reports on dynamical changes in the distance between two fluorophores. Since the first measurement of FRET between a single donor and acceptor (6), this technique has been applied to study conformational dynamics of proteins and nucleic acids, as well as protein and RNA folding (reviewed in (7)).
A major advantage of single-molecule techniques is the lack of averaging over large populations of molecules. Single-molecule FRET reports directly on conformational states and conformational dynamics of single biomolecules. Without the need for triggering or synchronization, time trajectories of donor and acceptor fluorescence reveal the dynamics of inter-conversion of different conformers. Hence this method is ideally suited to reveal conformational changes in enzyme catalytic cycles.
Confocal microscopy
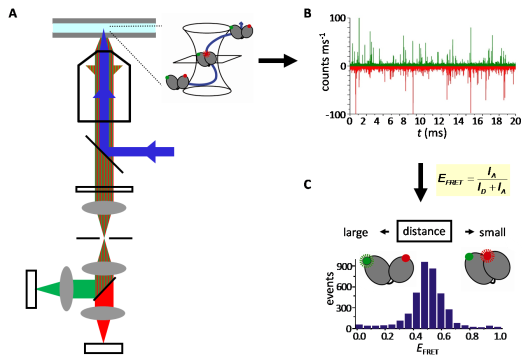
Ratiometric single-molecule FRET experiments on freely diffusing biomolecules are performed using an inverted confocal microscope with (pulsed) laser excitation and high-sensitivity detection. The laser light is focused into a small spot, the confocal volume, by an objective. Diffusion of fluorescent molecules through this confocal volume leads to excitation and emission of fluorescence bursts. The emitted light is collected through the same objective, separated from the excitation light by a beam splitter, split into donor and acceptor contributions using a second beamsplitter, and detected by highly sensitive avalanche photodiodes (Figure 3). FRET efficiencies from many single bursts are plotted in FRET histograms to identify conformational subpopulations (Figure 4).
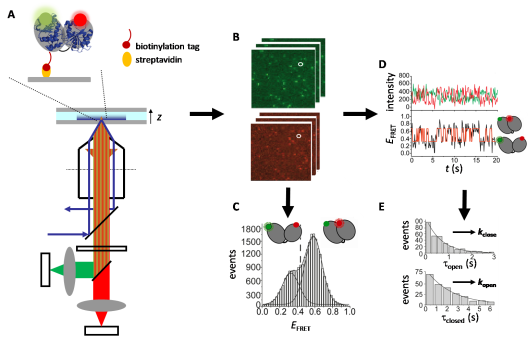
Figure 3: Principle of confocal microscopy.
A: Confocal microscope. blue; excitation light, green/red: donor/acceptor emission. B: Donor and acceptor fluorescence time traces. Each burst contains fluorescence from one molecule diffusing through the confocal volume. C: From the donor and acceptor fluorescence, ID and IA, in each burst, histograms of the FRET efficiency, EFRET, can be calculated.
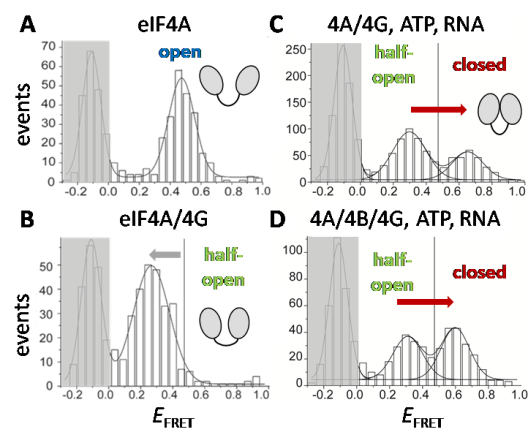
Figure 4: FRET histograms of different conformations of the translation initiation factor eIF4A.
A: eIF4A on its own is in an open conformation with low FRET efficiency EFRET. B: When eIF4G is present, eIF4A is stabilized in a different conformation with a lower FRET efficiency (half-open). C: In the presence of ATP and RNA, eIF4A in the eIF4A/eIF4G complex can either adopt a low-FRET state (half-open) or a high-FRET state (closed conformation). D: When eIF4B is also present, the fraction of the high-FRET closed conformation is increased. Modified after Andreou, A.Z. & Klostermeier, D. (2014) eIF4B and eIF4G jointly stimulate eIF4A ATPase and unwinding activities by modulation of the eIF4A conformational cycle, J. Mol. Biol. 426(1): 51-61.
Total internal reflection microscopy
In single-molecule FRET experiments using a confocal microscope, the observation time is limited by the diffusion time of the molecule through the confocal volume of the microscope (ms). For reactions on longer time scales, the observation time can be increased by using total internal reflection microscopy with fluorescent molecules immobilized on the cover-slip. Total internal reflection at the cover-slip/sample interface leads to an evanescent field in the sample.
The light intensity decreases exponentially with increasing distance from the cover-slip surface. Thus, molecules close to the surface are selectively excited. Fluorescence from single molecules is collected through the objective, and imaged onto a fast CCD camera (Figure 5). In this set-up, the observation time is only limited by photobleaching of the fluorescent dye (min), and conformational dynamics on the 100 ms min time scale can be studied (Figure 6).
Figure 5: Total internal reflection microscopy.
A: In a TIRF microscope, the blue excitation light is coupled into the objective off-axis to generate conditions for total internal reflection. Molecules within the evanescent field (blue gradient) are excited, and their fluorescence (green, red) is collected by the objective and imaged onto different areas of a CCD camera. B: Sets of images (green: donor, red: acceptor) are generated; each spot corresponds to a single molecule immobilized on the surface. C: From these spots, the donor and acceptor fluorescence intensities can be determined, and the FRET efficiency EFRET can be calculated and histogrammed. D: From a series of image pairs at different time points, donor and acceptor fluorescence time traces as well as FRET time traces can be calculated. E: From the dwell times of the molecules in the high- and low-FRET states, rate constants for the conformational changes occurring can be derived.
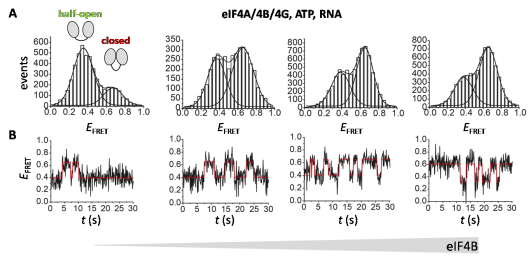
Figure 6: Conformational dynamics of eIF4A in the presence and absence of eIF4B.
A: FRET histograms from TIRF experiments with donor-acceptor-labeled eIF4A in the absence (left) and presence of increasing concentrations of eIF4B. eIF4B shifts the conformational equilibrium of eIF4A towards the closed state. B: Selected FRET time traces. eIF4B accelerates conformational switching of eIF4A. Modified after Andreou, A.Z. Harms, U. & Klostermeier, D. (2019) Single-stranded regions modulate conformational dynamics and ATPase activity of eIF4A to optimize 5’-UTR unwinding, Nucleic Acids Res. 47(10):5260-5275.
References:
O'Connor, D., Phillips, D. (1984). Time-Correlated Single Photon Counting, Academic Press, London
Klostermeier, D., and Millar, D. P. (2001). Methods 23(3), 240-254
Klostermeier, D., and Millar, D. P. (2001). Biopolymers 61(3), 159-179
Shera, E. B., Seitzinger, N. K., Davis, L. M., Keller, R. A., and Soper, S. A. (1990). Chem. Phys. Lett. 174, 553-557
Weiss, S. (1999). Science 283(5408), 1676-1683
Deniz, A. A., Dahan, M., Grunwell, J. R., Ha, T., Faulhaber, A. E., Chemla, D. S., Weiss, S., and Schultz, P. G. (1999). Proc. Natl. Acad. Sci. USA 96(7), 3670-3675
Myong, S., Stevens, B. C., and Ha, T. (2006). Structure 14(4), 633-643