
Münster's climate
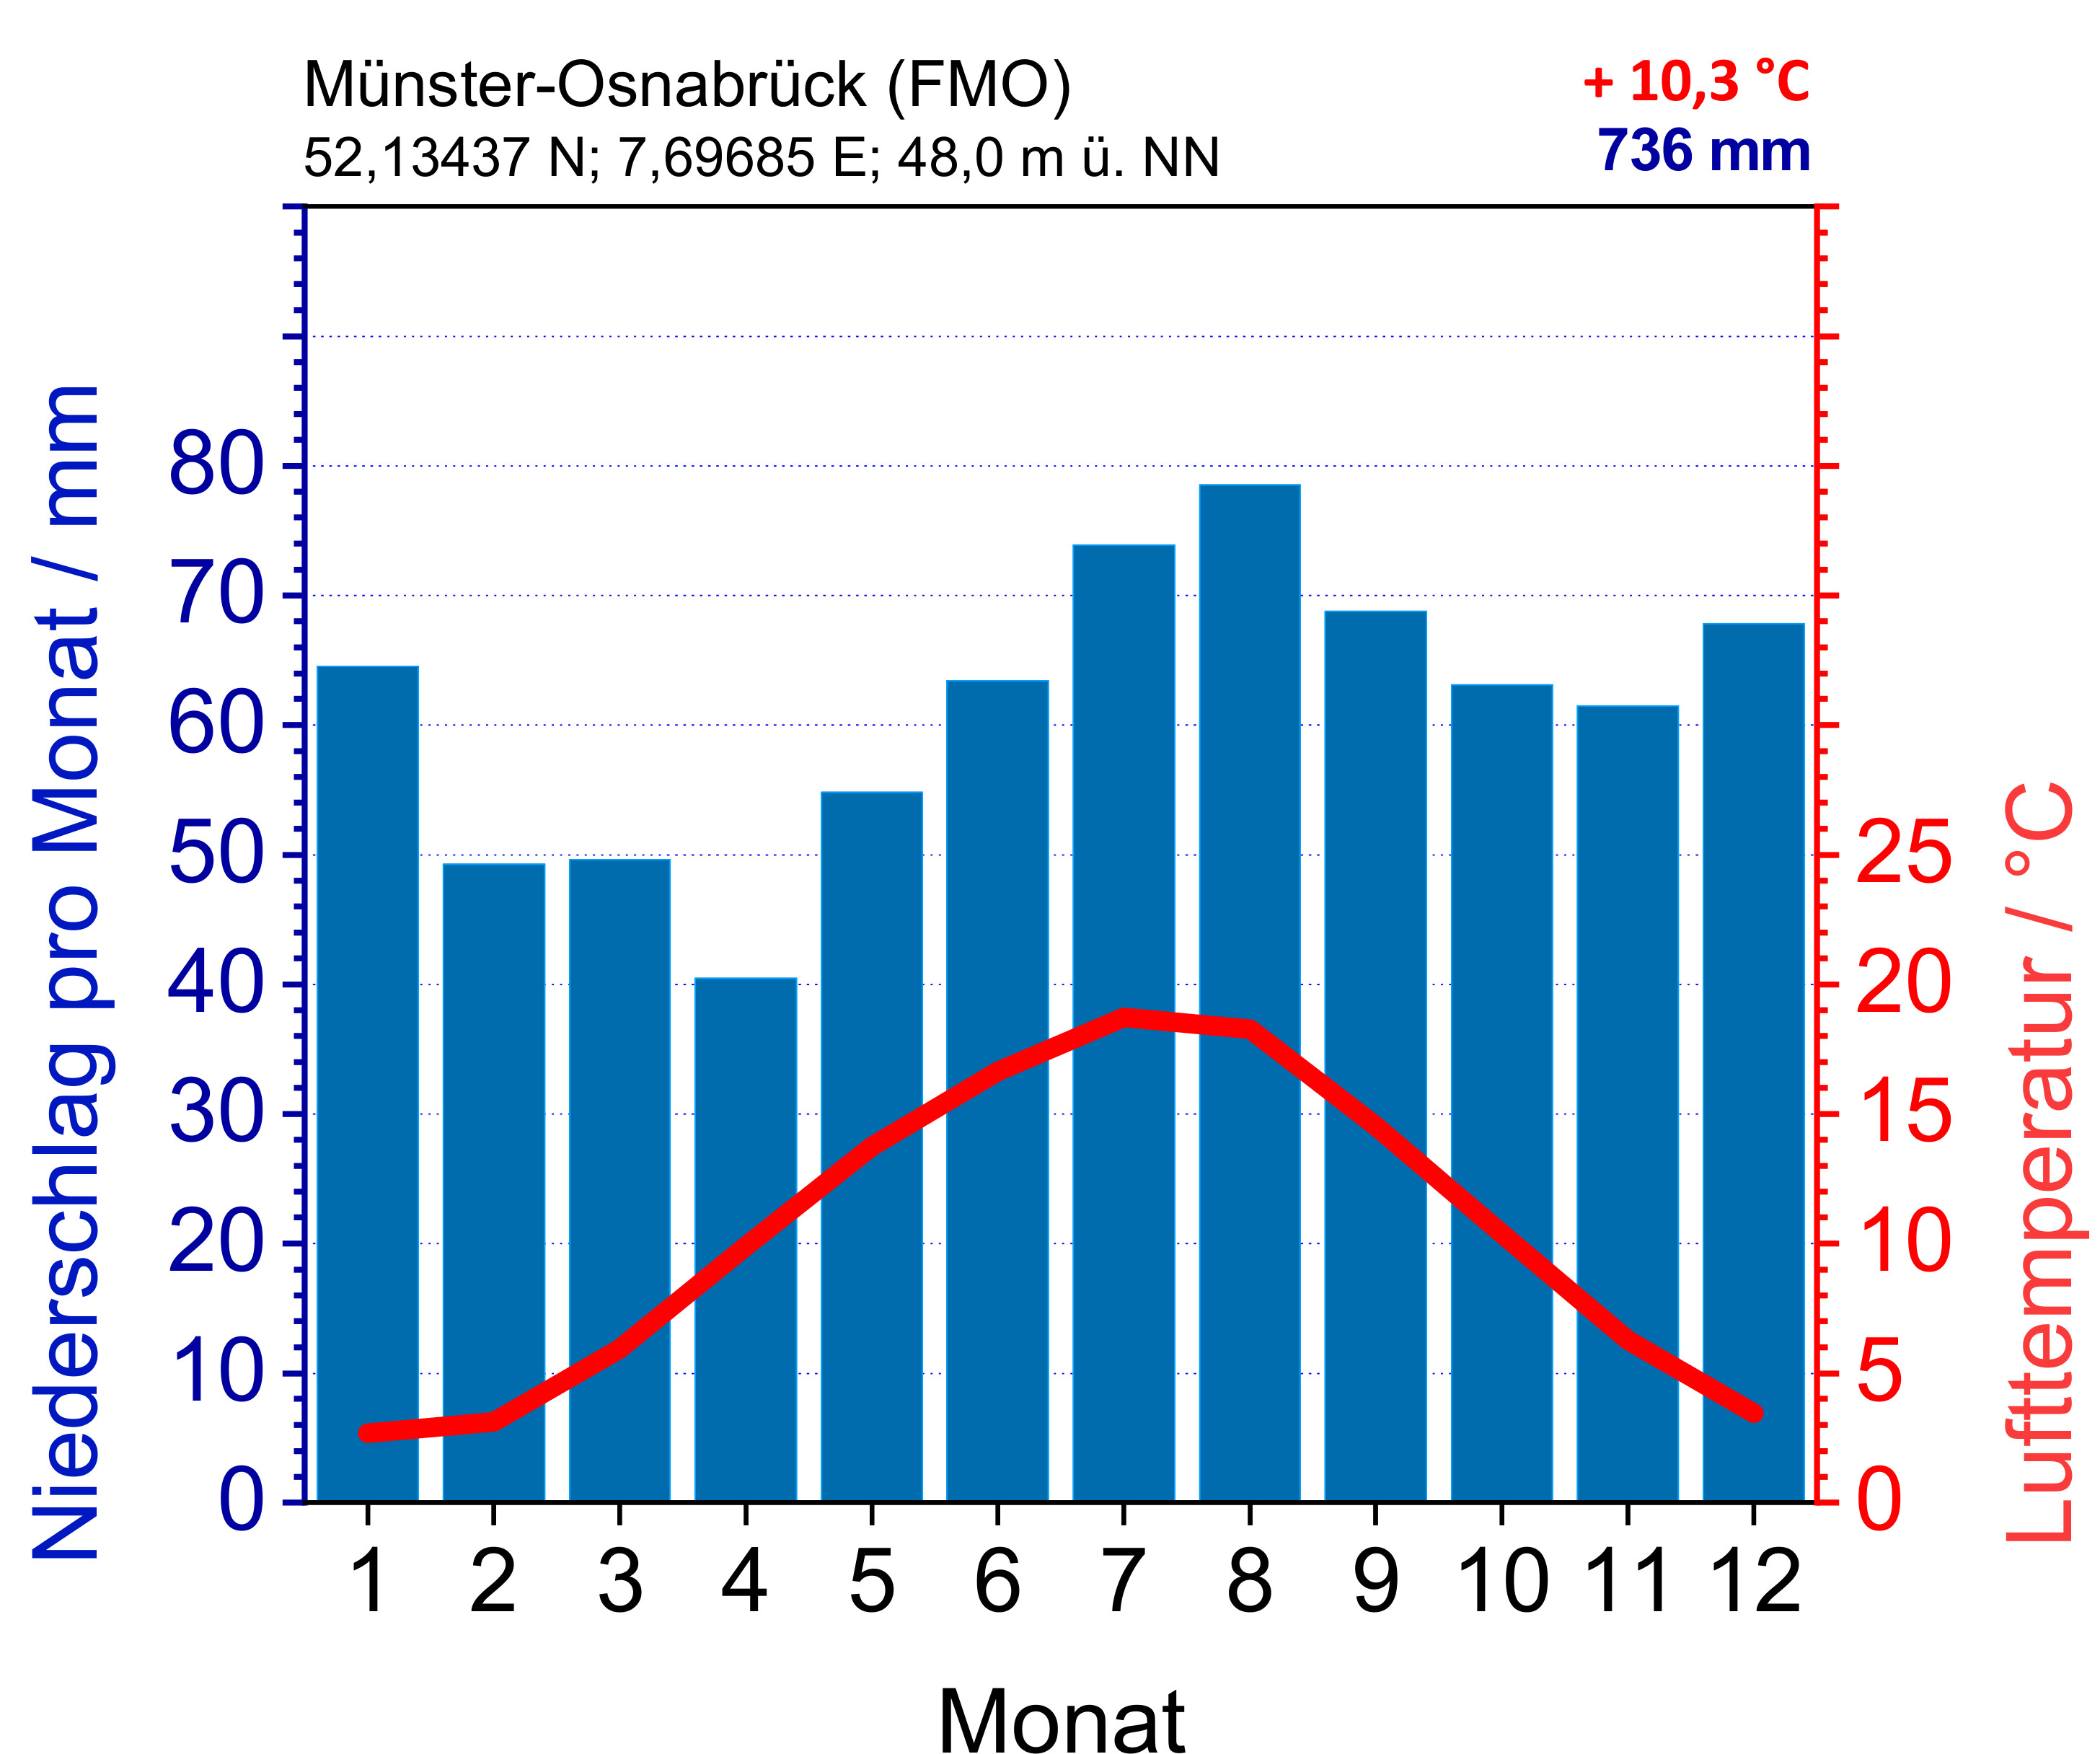
The climatic diagram shows the average monthly climate of the station Münster-Osnabrück Airport (DWD 1766) for the period from 1991 to 2020. Climate is usually determined over a 30-year interval. The blue bar represents the monthly rainfall (left scale, unit: mm, liter / m²), the red line represents the monthly temperature average (right scale, unit ° C). In addition, the location of the station, the annual average of the temperature and the annual sum of the rainfall is stated. Furthermore, the highest and lowest temperatures measured during the period are shown.
| Parameter | Jan | Feb | Mar | Apr | May | June | July | Aug | Sept | Oct | Nov | Dec | Year |
| Temperature (°C) | +2,7 | +3,1 | +5,9 | +9,9 | +13,7 | +16,6 | +18,7 | +18,3 | +14,5 | +10,4 | +6,3 | +3,5 | +10,3 |
| Precipitation (mm) | 65 | 49 | 50 | 40 | 55 | 63 | 74 | 79 | 69 | 63 | 61 | 68 | 736 |
| Sunshine (h) | 52 | 73 | 124 | 178 | 207 | 203 | 212 | 192 | 148 | 109 | 57 | 45 | 1498 |