


Next: About this document ...
Up: Inverse Time-Dependent Quantum Mechanics
Previous: Inverse Time-Dependent Quantum Mechanics
-
- 1
-
K. Chadan and P. C. Sabatier, Inverse Problems in Quantum Scattering
Theory (Springer Verlag, New York, 1989).
- 2
-
R. G. Newton, Inverse Schrödinger Scattering in Three Dimensions
(Springer Verlag, Berlin, 1989).
- 3
-
J. M. Bernado and A. F. Smith, Bayesian Theory (Wiley, New York, 1994).
- 4
-
J. C. Lemm, J. Uhlig, and A. Weiguny, Technical Report No. MS-TP1-99-6, Univ. of Münster, arXiv:cond-mat/9907013 (accepted for
publication by Phys. Rev. Lett.
- 5
-
J. C. Lemm and J. Uhlig, Technical Report No. MS-TP1-99-10, Univ. of
Münster, arXiv:nucl-th/9908056.
- 6
-
G. Wahba, Spline Models for Observational Data (SIAM, Philadelphia,
1990).
- 7
-
C. K. I. Williams and C. E. Rasmussen, in NIPS 8, edited by D. S.
Touretzky, M. C. Mozer, and M. E. Hasselmo (The MIT Press, Cambridge, MA,
1996), pp. 514-520.
- 8
-
C. K. I. Williams and D. Barber, IEEE Trans. on Pattern Analysis and Machine
Intelligence 20, 1342 (1998).
- 9
-
J. C. Lemm, Technical Report No. MS-TP1-99-1, Univ. of Münster,
arXiv:physics/9912005.
- 10
-
D. J. C. MacKay, in Maximum Entropy and Bayesian Methods, Santa Barbara
1993., edited by G. Heidbreder (Kluwer, Dordrecht, 1994).
- 11
-
B. Efron and R. J. Tibshirani, An Introduction to the Bootstrap (Chapman
& Hall, New York, 1993).
Figure 1:
Time evolution of an unobserved particle
with mass  = 1 started at time
  = 0 from
  = 0
in the potential (16).
Shown is the transition probability
= 0
in the potential (16).
Shown is the transition probability
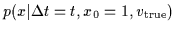 .
.
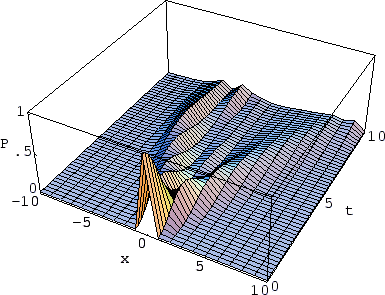 |
Figure 2:
Time evolution of an observed particle with mass = 1
in the potential (16).
The figure shows for each data point  the probability
 ,
starting from = 0.
(Hence, the probability at =1 corresponds to that shown in
Fig. 1 at
,
starting from = 0.
(Hence, the probability at =1 corresponds to that shown in
Fig. 1 at  = 5.)
The actual data points
= 5.)
The actual data points  have been sampled from that
probabilities and form the observed path
shown on top as a thick line.
have been sampled from that
probabilities and form the observed path
shown on top as a thick line.
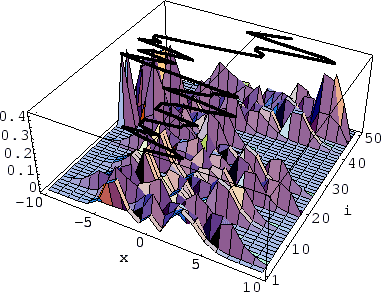 |
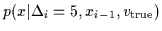
Figure 3:
Numerical reconstruction of a potential
from 50 coordinate measurements
(see Fig. 2).
Shown are
the true potential  (thin line),
the best parametric approximation
used as reference potential
(thin line),
the best parametric approximation
used as reference potential  (dashed line),
and the reconstructed potential
(dashed line),
and the reconstructed potential  (thick line).
Parameters: = 1,
(thick line).
Parameters: = 1,
 = 5,
of Eq. (16),
of the form (18),
Gaussian prior with
= 5,
of Eq. (16),
of the form (18),
Gaussian prior with
 as in (17)
with
as in (17)
with  = 0.1 and
  = 3,
= 3,
 (6)
with
(6)
with  = 10 and
  =
=
 ,
periodic boundary conditions for
,
periodic boundary conditions for  ,
fixed boundary values
,
fixed boundary values  =
=  =
=  for , and ,
calculated on a lattice with 21 points.
Errors:
for , and ,
calculated on a lattice with 21 points.
Errors:
 = 99.1,
 = 104.4,
 = 1.891,
 = 1.818.
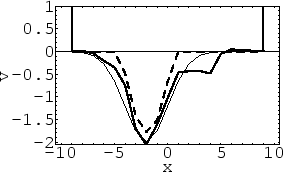 |
Figure 4:
Sum of empirical transition probabilities
 (bars),
the corresponding true
(bars),
the corresponding true
 (thick line)
for ,
and the reconstructed
(thick line)
for ,
and the reconstructed
 (thin line).
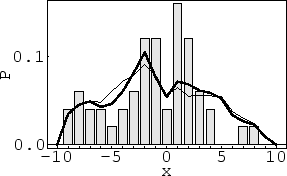 |
Figure 5:
Same functions as in Fig. 4,
but restricted to measurements of a particle
which has been at position
 = 1 at the time of the previous measurement.
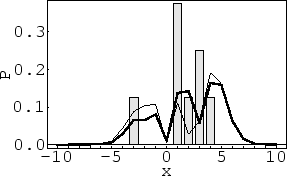 |
Next: About this document ...
Up: Inverse Time-Dependent Quantum Mechanics
Previous: Inverse Time-Dependent Quantum Mechanics
Joerg_Lemm
2000-02-02