|
|
||||||||||||||||||||||||||||||||||||||||||||||||||||||||||||||||||||||||||||||||||||||||||||||||||||||||||||||||||||||||||||||||||||||||||||||||||||||||||||||
|
Free Neuropathology 6:7 (2025) |
||||||||||||||||||||||||||||||||||||||||||||||||||||||||||||||||||||||||||||||||||||||||||||||||||||||||||||||||||||||||||||||||||||||||||||||||||||||||||||||
|
Original Paper |
||||||||||||||||||||||||||||||||||||||||||||||||||||||||||||||||||||||||||||||||||||||||||||||||||||||||||||||||||||||||||||||||||||||||||||||||||||||||||||||
|
Increased frontocortical microvascular raspberry density in frontotemporal lobar degeneration compared to Lewy body disease and control cases: a neuropathological study |
||||||||||||||||||||||||||||||||||||||||||||||||||||||||||||||||||||||||||||||||||||||||||||||||||||||||||||||||||||||||||||||||||||||||||||||||||||||||||||||
|
Henric Ek Olofsson 1 , Elisabet Englund 1 |
||||||||||||||||||||||||||||||||||||||||||||||||||||||||||||||||||||||||||||||||||||||||||||||||||||||||||||||||||||||||||||||||||||||||||||||||||||||||||||||
|
||||||||||||||||||||||||||||||||||||||||||||||||||||||||||||||||||||||||||||||||||||||||||||||||||||||||||||||||||||||||||||||||||||||||||||||||||||||||||||||
|
Corresponding author:
|
||||||||||||||||||||||||||||||||||||||||||||||||||||||||||||||||||||||||||||||||||||||||||||||||||||||||||||||||||||||||||||||||||||||||||||||||||||||||||||||
|
Submitted: 01 January 2025
|
||||||||||||||||||||||||||||||||||||||||||||||||||||||||||||||||||||||||||||||||||||||||||||||||||||||||||||||||||||||||||||||||||||||||||||||||||||||||||||||
|
Keywords: Angiogenesis, Cerebrovascular disorders, Frontotemporal lobar degeneration, Lewy body disease, Neurodegenerative diseases |
||||||||||||||||||||||||||||||||||||||||||||||||||||||||||||||||||||||||||||||||||||||||||||||||||||||||||||||||||||||||||||||||||||||||||||||||||||||||||||||
|
Abstract Background: Brain raspberries are histologically defined microvascular entities that are highly prevalent in the neocortex. Increased cortical raspberry density occurs in vascular dementia, but also with advancing age. Here, we examined the raspberry density in two neurodegenerative diseases, wherein vascular alterations distinct from conventional vascular risk factors have been indicated: frontotemporal lobar degeneration (FTLD) and Lewy body disease (LBD). Methods: This retrospective study included 283 clinically autopsied individuals: 105 control cases without neurodegenerative disease, 98 FTLD cases (mainly FTLD-tau and FTLD-TDP), and 80 LBD cases (mainly neocortical). The raspberry density was quantified on haematoxylin-eosin-stained tissue sections from the frontal cortex, and the frontocortical atrophy was ranked 0–3. Results: There was a higher raspberry density in the FTLD group compared to both other groups (P ≤ 0.001; Games-Howell post hoc test). The difference between the FTLD and LBD groups remained significant in multiple linear regression models that included age, sex, and either brain weight (P = 0.034) or cortical atrophy (P = 0.012). The difference between the FTLD and control groups remained significant when including age, sex, and brain weight in the model (P = 0.004), while a trend towards significance was demonstrated when including age, sex, and cortical atrophy (P = 0.054). Further analyses of the FTLD group revealed a trend towards a positive correlation between raspberry density and cortical atrophy (P = 0.062; Spearman rank correlation). Comparisons of FTLD subgroups were inconclusive. Conclusion: The frontocortical raspberry density is increased in FTLD. An examination of the raspberry density in relation to a quantitative measure of cortical atrophy is motivated to validate the results. Future studies are needed to determine whether increased raspberry density in FTLD could function as a marker for more widespread vascular alterations, and to elucidate the relation between microvascular alterations and neurodegenerative disease. |
||||||||||||||||||||||||||||||||||||||||||||||||||||||||||||||||||||||||||||||||||||||||||||||||||||||||||||||||||||||||||||||||||||||||||||||||||||||||||||||
|
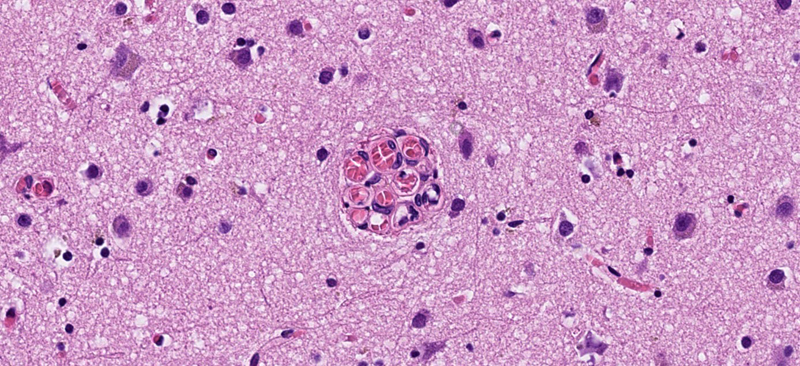
Abbreviations C9orf72 - chromosome 9 open reading frame 72 gene, CBD - corticobasal degeneration, FTD - frontotemporal dementia, FTLD - frontotemporal lobar degeneration, FUS - fused in sarcoma, GRN - progranulin gene, LBD - Lewy body disease, MAPT - microtubule-associated protein tau gene, NFT - neurofibrillary tangle, NOS - not otherwise specified, PiD - Pick’s disease, PSP - progressive supranuclear palsy, TDP-43 - transactivation response DNA-binding protein 43, UPS - ubiquitin proteasome system. Introduction Frontotemporal lobar degeneration (FTLD) and Lewy body disease (LBD) are two heterogeneous neuropathological entities that manifest with cellular inclusions and neuronal loss. FTLD cases are classified based on the abnormal protein contents of the cellular inclusions: microtubule-associated protein tau, transactivation response DNA-binding protein (TDP) 43, fused in sarcoma (FUS), or proteins of the ubiquitin proteasome system (UPS) [1, 2]. FTLD is not known to be associated with conventional vascular risk factors [3], but recent studies on human tissue indicate structural and functional cerebrovascular alterations that may be intrinsic to the disease [4–10]. Lewy body disease (LBD) is characterised neuropathologically by alpha-synuclein containing inclusions [11, 12]. Like FTLD, LBD has not been associated with conventional vascular risk factors [13, 14], but potential mechanisms of cortical hypoperfusion have been described, including cardiovascular autonomic dysfunction [15–17], intrinsic cholinergic denervation of blood vessels [18–20], impaired cortical angiogenesis [21], and reduced cortical capillary density [22, 23]. Information on histopathological signs of cerebrovascular alterations in FTLD and LBD is limited. We have previously applied the term “raspberry” to refer to a histological finding of ≥ 3 transversally sectioned vascular lumen within a common perivascular space (Fig. 1) [24–27]. A more recently introduced and similarly defined term is “multi-lumen vascular profiles” [28]. To illustrate the link to our previous studies, the term “raspberry” will be used in the present work. There are older terms (including glomerular loop formations, vascular bundles, vascular wickerworks, and vascular convolutes) that refer to several distinct vascular formations which are best visualised three-dimensionally but lack definitions adapted for a two-dimensional histological context [29–32]. Raspberries may constitute cross-sectional counterparts to some of these vascular formations, but the extent of this overlap has not been established.
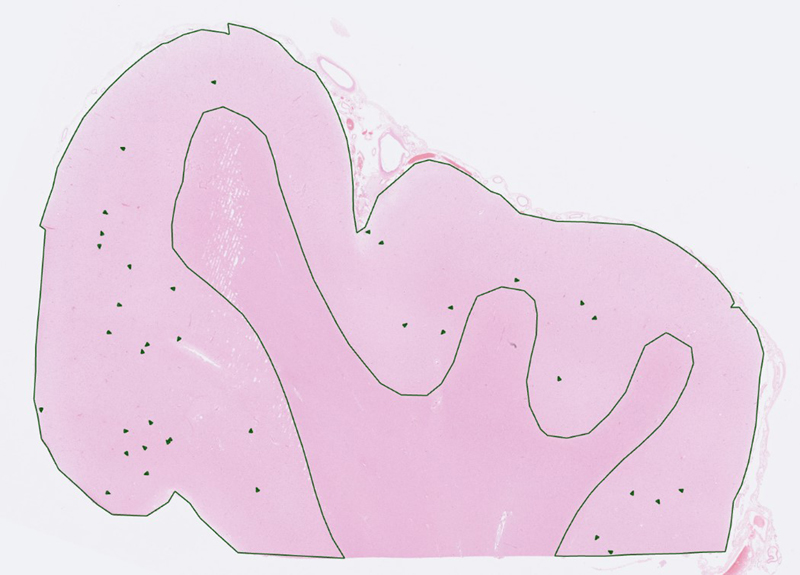
Fig. 1 A cortical microvascular raspberry, measuring 60 μm in diameter. Stain: haematoxylin-eosin. In archival brain tissue from postmortem neuropathological examinations, raspberries are highly prevalent in the neocortex, basal ganglia, hippocampus, and brainstem, while occurring only rarely in white matter and in the cerebellum [26]. In our experience, raspberries are typically composed of arterioles and may focally constitute up to 3 % of the cortical blood vessels. We have previously demonstrated increased cortical raspberry density in association with vascular dementia [24], cerebral atherosclerosis [25, 26], and hypertensive disease (exploratory finding [27]), potentially indicating that the mechanisms of raspberry formation overlap with those that lead to cerebrovascular disease. However, an independent, positive association between raspberry density [27], or multi-lumen vascular profiles [28], and advancing age has also been observed, indicating that additional mechanisms may be involved, as ageing is associated with distinct effects on the vasculature [33, 34]. Knowledge on the distribution of raspberries among neurodegenerative diseases would be valuable to further explore the extent to which increased raspberry density may occur separately from conventional vascular risk factors and cerebrovascular disease. We have previously observed an increased cortical raspberry density in a small group of FTLD patients (n = 10) compared to control cases, but this finding did not achieve statistical significance [24]. The same study indicated a similar but weaker trend for patients with Alzheimer’s disease [24], while a later study provided no indication of an increased raspberry density in patients with Alzheimer pathology [27]. No previous study has been designed to examine the raspberry density in LBD. An investigation including LBD would also enable stratification according to co-occurring Alzheimer pathology, which frequently accompanies this disease [35]. As such, the aim of the current study was to examine the frontocortical raspberry density in frontotemporal lobar degeneration (FTLD) and Lewy body disease (LBD) in an adequately dimensioned study sample, and to progress with exploratory subgroup analyses if supported by the primary statistical analysis. Materials and methods Study population The study population was drawn retrospectively from patients who had undergone a diagnostic postmortem neuropathological examination at Clinical Genetics, Pathology, and Molecular Diagnostics, Region Skane, Lund. The autopsy reports were accessed via the digital systems Sympathy (cases prior to April 2019) and LIMS RS. The medical records were accessed via the digital system Melior, in which public specialist healthcare performed in Region Skane is documented. All histotechnical procedures and diagnostic examinations had been performed prior to the start of the study; the details of the macro- and microscopic neuropathological examination have been described previously [36]. Cases with FTLD and LBD were retrieved from January 2001 to December 2022. The FTLD cases had been diagnosed according to published consensus recommendations, including, when applicable, assignment of a specific diagnosis [1, 2, 37–40]. Likewise, the LBD cases had been diagnosed according to consensus recommendations; for inclusion, the cases needed to be of neocortical or limbic category [11, 12]. The control cases were drawn from April 2019 to December 2022 and consisted of individuals who were over 49 years old at death and who were not diagnosed with dementia according to the medical records. In all cases, the autopsy reports were assessed regarding co-occurring neuropathology. Brain weight and findings of atherosclerotic plaques in the basilar artery and circle of Willis were noted (referred to as cerebral atherosclerosis), as were findings of cerebral arteriolosclerosis [41]. Mixed pathology defined as more than one cerebral infarct resulted in exclusion. Likewise, co-occurring neurodegenerative disease resulted in exclusion, with the exception of primary age-related tauopathy or Alzheimer’s disease neuropathologic change with neurofibrillary tangle (NFT) pathology corresponding to Braak stage II or lower [42–44]. In cases with LBD, NFT pathology up to Braak stage IV was accepted due to the known co-occurrence of LBD and Alzheimer-type pathology [35]. Other forms of neuropathological comorbidity were noted, but did not result in exclusion. Patients included in our previous study on raspberries in FTLD were deemed eligible for inclusion, since they were considered not to differ from the rest of the study sample in any systematic way [24]. After assessment, nine of the ten FTLD cases from this previous study were included (in one case, an adequately dimensioned glass slide was not available; see next section). Because the raspberry density of these cases had been measured using an older method, they were re-quantified along with the other cases, as described in the next section. Raspberry quantification and assessment of cortical atrophy The raspberry quantification was performed on whole slide images of scanned tissue sections in the same manner as in our latest study on this topic [27]. For each included individual, the cortical area of one 6-μm thick haematoxylin-eosin-stained tissue section from the frontal lobe (prepared from a formalin-fixed paraffin-embedded tissue block and mounted on a 76 × 26 mm glass slide) was viewed in either Aperio ImageScope (cases prior to April 2019) or Sectra IDS7. The tissue section had been sampled from Brodmann area 10 in most cases, but tissue sections from other parts of the frontal lobe were also considered acceptable. For each tissue section, the number of cortical raspberries was noted, correlated with the size of the examined area (median 1.89 cm²), and reported as raspberries/cm² (Fig. 2). All quantification was performed blinded to patient characteristics.
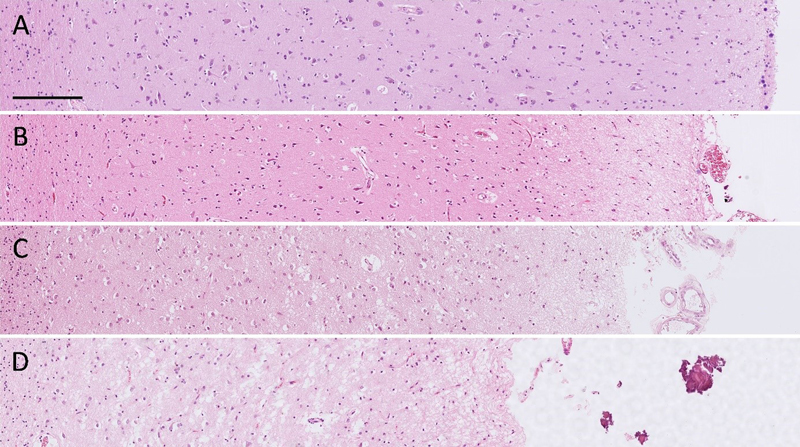
Fig. 2 Overview of a tissue section from the frontal lobe. The cortex has been delineated, and the raspberries within the delineated area have been marked. Stain: haematoxylin-eosin. The degree of frontocortical atrophy was assessed in well-orientated parts of the tissue samples and ranked on a scale from 0 to 3 (none, mild, moderate, or severe) based on the overall impression of cortical thinning, neuropil rarefaction, and neuronal loss. To aid in the assessment, each slide was compared to a template of representative micrographs (Fig. 3). All assessments were performed by a single examiner without access to data on raspberry density or other patient characteristics.
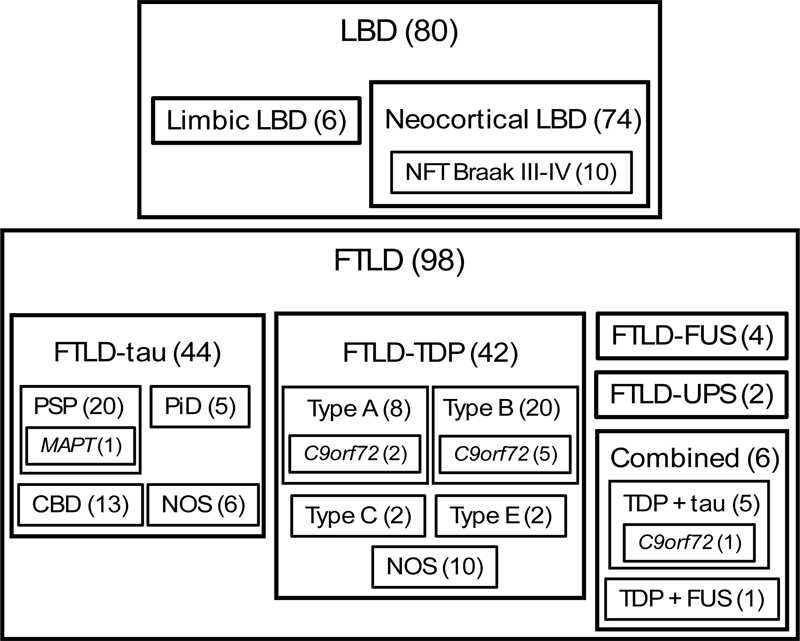
Fig. 3 A–D Template with representative micrographs ranked as A no (0), B mild (1), C moderate (2), and D severe (3) frontocortical atrophy. Stain: haematoxylin-eosin. Scalebar: 200 μm. Statistics A sample size calculation performed in Epitools [45] indicated that 88 individuals per group would enable the detection of a mean difference in raspberry density of 3 raspberries/cm² with a 95 % level of confidence and 80 % statistical power. When increasing the level of confidence to 98 % to provide an approximate adjustment for multiple tests (three tests), a group size of 112 individuals was indicated. As such, we aimed to include at least 88 individuals per group, and optimally 112 individuals per group. IBM SPSS Statistics Version 28 was used to perform the statistical analyses. The difference in mean raspberry density between the three groups was analysed using one-way Welch’s ANOVA, followed by the Games-Howell post hoc test due to the unbalanced design. When the post hoc test indicated a difference between any two of the groups, they were further analysed with two multiple linear regression models wherein age, sex, and either brain weight or microscopic cortical atrophy were included as potential confounding factors. Exploratory subgroup analyses addressed the raspberry density in relation to neurodegenerative disease subtype (tested with the non-parametric Kruskal-Wallis test), and in relation to brain weight and cortical atrophy (tested with Spearman rank correlation). A P value of ≤ 0.05 was considered statistically significant. Results The control group consisted of 105 individuals, the LBD group of 80 individuals, and the FTLD group of 98 individuals (the distribution of LBD and FTLD subtypes is shown in Fig. 4). Demographics, markers of brain atrophy, and neuropathological findings of cerebrovascular disease are reported in Table 1; other neuropathological findings did not occur in the FTLD and LBD groups, with the exception of two cases in the LBD group, who had been diagnosed with cerebral metastases. In the control group, the neuropathological findings were more diverse, but the raspberry density of control cases with neuropathological comorbidity (which constituted 31 % of the control group) was similar to that of control cases with no comorbidity (Table 2).
Fig. 4 Neuropathological classification of the LBD and FTLD groups. Numbers in brackets indicate n. C9orf72 chromosome 9 open reading frame 72 gene; CBD corticobasal degeneration; FTLD frontotemporal lobar degeneration; FUS fused in sarcoma; LBD Lewy body disease; MAPT microtubule-associated protein tau gene; NFT neurofibrillary tangle; NOS not otherwise specified; PiD Pick’s disease; PSP progressive supranuclear palsy; TDP transactivation response DNA-binding protein; UPS ubiquitin proteasome system.
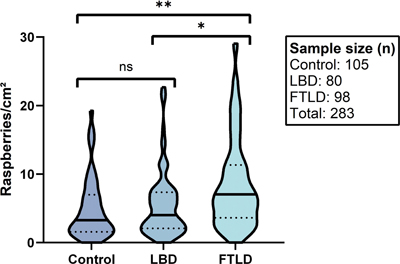
There was a higher raspberry density in the FTLD group compared to both the LBD and control groups, and a slightly higher raspberry density in the LBD group compared to the control group (Fig. 5). The one-way Welch’s ANOVA indicated statistically significant differences between the three groups (P < 0.001), and the Games-Howell post hoc test demonstrated significant differences between the FTLD and control groups (P < 0.001), as well as between the FTLD and LBD groups (P = 0.001). In contrast, the LBD and control groups did not differ at a statistically significant level (P = 0.69).
Fig. 5 Raspberry density (raspberries/cm²) of the frontal cortex in relation to FTLD, LBD, and control cases. Lines and dots indicate medians and interquartile ranges, respectively. * P = 0.001 (Games-Howell post hoc test). ** P < 0.001 (Games-Howell post hoc test). FTLD frontotemporal lobar degeneration; LBD Lewy body disease; ns not significant. When comparing the FTLD group to the LBD group using multiple linear regression, the difference in raspberry density remained statistically significant when including age, sex, and either brain weight or microscopic cortical atrophy in the analysis (Table 3). When comparing the FTLD group to the control group, the results remained statistically significant when including age, sex, and brain weight in the analysis, while a trend towards statistical significance was observed when instead including age, sex, and cortical atrophy (Table 4).
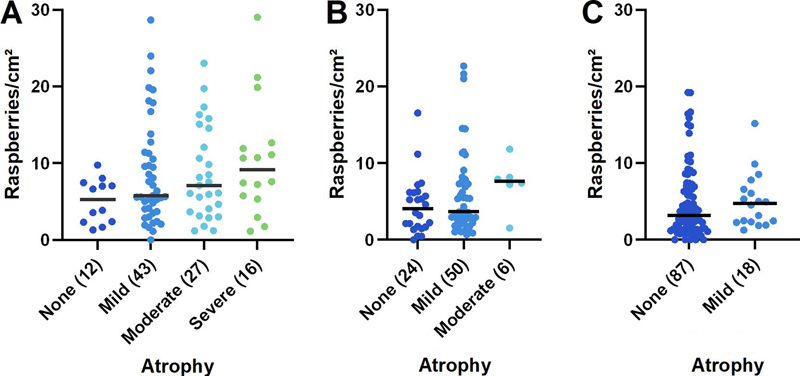
Given the results of the primary statistical analysis, further analyses were undertaken to explore the variation in raspberry density within the FLTD group. These demonstrated a trend towards a positive correlation between raspberry density and microscopic cortical atrophy (P = 0.062; rho = 0.19; Fig. 6, A), and a corresponding trend towards a negative correlation between raspberry density and brain weight (P = 0.078; rho = -0.19; Fig. 7, A). The most frequent diagnosis among FTLD cases with no cortical atrophy was progressive supranuclear palsy, whereas most cases with severe cortical atrophy were diagnosed with FTLD-TDP (various types). As expected, cortical atrophy correlated negatively with brain weight (P < 0.001; rho = -0.55).
Fig. 6 A–C Raspberry density (raspberries/cm²) of the frontal cortex in relation to microscopic cortical atrophy in A FTLD (P = 0.062; rho = 0.19; Spearman rank correlation), B LBD (not statistically analysed) and C control cases (not statistically analysed). Lines indicate medians; numbers in brackets indicate n. FTLD frontotemporal lobar degeneration; LBD Lewy body disease.
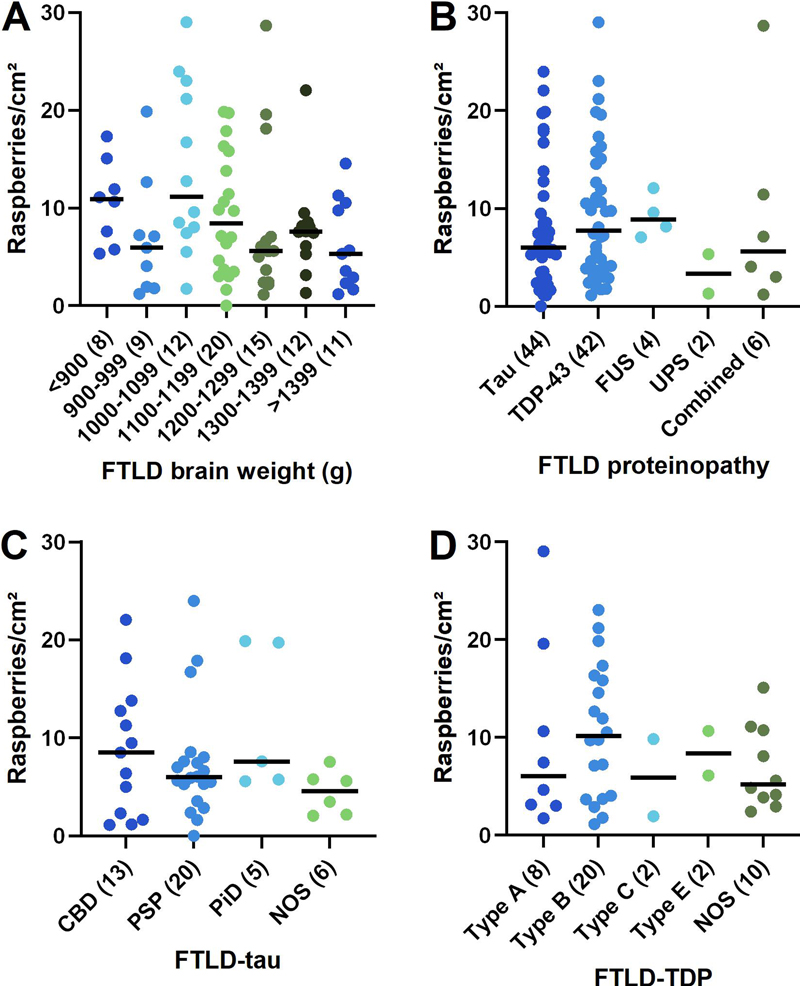
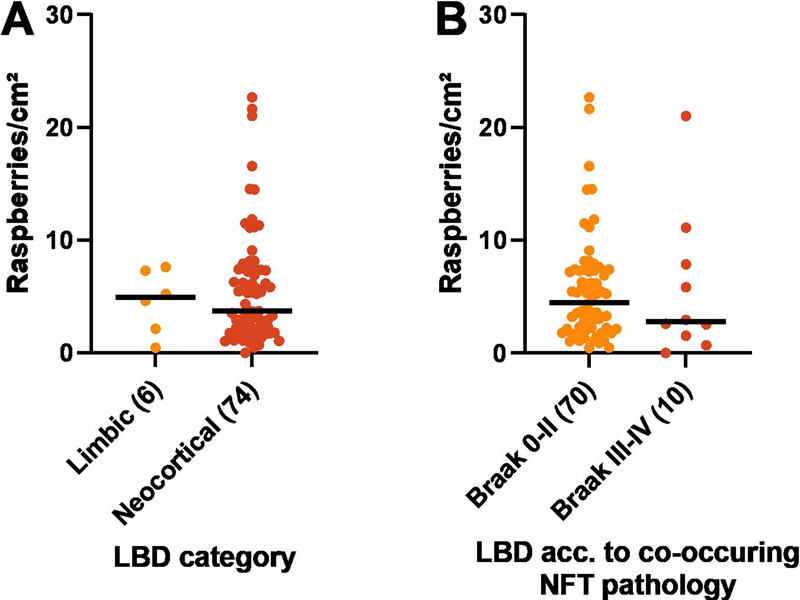
Fig. 7 A–D Raspberry density (raspberries/cm²) of the frontal cortex in FTLD in relation to A brain weight (P = 0.078; rho = -0.19; Spearman rank correlation), B proteinopathy (P = 0.46; Kruskal-Wallis test), C FTLD-tau (P = 0.28; Kruskal-Wallis test), and D FTLD-TDP (P = 0.52; Kruskal-Wallis test). Lines indicate medians; numbers in brackets indicate n. The statistical analyses of raspberry density in relation to B–D remained inconclusive also after excluding small groups (n < 5; not shown). CBD corticobasal degeneration; FTLD frontotemporal lobar degeneration; FUS fused in sarcoma; NOS not otherwise specified; PiD Pick’s disease; PSP progressive supranuclear palsy; TDP-43 transactivation response DNA-binding protein 43, UPS ubiquitin proteasome system. Non-parametric testing (Kruskal-Wallis) was inconclusive when analysing the raspberry density in FTLD in relation to proteinopathy (P = 0.46) and specific diagnosis; the latter comparisons were restricted to FTLD-tau (P = 0.28) and -TDP (P = 0.52; Fig. 7, B–D). These analyses remained inconclusive also after excluding small groups (n < 5; not shown). For descriptive data on the raspberry density in LBD in relation to limbic/neocortical category and presence/absence of Braak stage III–IV NFT pathology, see Fig. 8, A–B.
Fig. 8 A–B Raspberry density (raspberries/cm²) of the frontal cortex in LBD in relation to A LBD category (not statistically analysed), and B co-occurring NFT pathology (not statistically analysed). Lines indicate medians; numbers in brackets indicate n. LBD Lewy body disease; NFT neurofibrillary tangle. Discussion The current study examined the raspberry density of the frontal cortex in FTLD, LBD and control cases, and found it to be increased in FTLD compared to both of the other groups. The results did not indicate any difference between the LBD and control groups. Based on our sample size calculation, the FTLD (n = 98) and control groups (n = 105) were considered sufficiently large, but the comparisons involving the LBD group (n = 80) were at risk of being underpowered. Low power could reduce the chances of detecting true differences, while also increasing the risk of overestimating effect sizes. With this limitation in mind, our results provide no indication of a relevant difference in frontocortical raspberry density between LBD and control cases. According to our multiple linear regression analysis, the increased raspberry density in FTLD relative to the LBD group was independent of variations in age, sex, brain weight, and microscopic cortical atrophy. The difference in raspberry density between the FTLD and control groups was statistically significant when including age, sex, and brain weight in the analysis, but not when exchanging brain weight for cortical atrophy (P = 0.054). It should be noted that most FTLD and LBD cases exhibited some degree of cortical atrophy, whereas most control cases did not. As such, it is possible that a larger study sample – wherein more FTLD and control cases would exhibit the same degree of cortical atrophy – could have achieved statistical significance. However, we also observed a trend towards a positive correlation between raspberry density and cortical atrophy in the FTLD group (P = 0.062), which is similar to the finding of an increasing endothelial cell proportion with increasing cortical atrophy described in a recent study on FTLD-TDP [9]. In one respect, our finding could indicate that the increased raspberry density in FTLD is at least partially secondary to cortical atrophy. Our previous studies on raspberries have not indicated an association between raspberry density and brain atrophy [26, 27], but such an association could still exist within the FTLD population (or in a broader context of neurodegeneration, as potentially indicated by the multiple linear regression models). Cortical atrophy could appear to increase the raspberry density by reducing the distance between blood vessels while the absolute number of vessels remains constant. Alternatively, neuropil rarefaction could reduce the stability around cortical arterioles and lower the threshold for arteriolar buckling and stretching with ensuing elongation [46], possibly resulting in crowding of multiple arteriolar branches within the same perivascular space. However, the trend towards a positive correlation between raspberry density and cortical atrophy could also be due to the FTLD disease process causing both cortical atrophy and raspberry formation. Notably, vascular alterations have been described in experimental studies on the pathomechanisms of tau and TDP-43 [47–52], in autopsy studies on FTLD [4–10], and in amyotrophic lateral sclerosis [53], an entity that overlaps clinically, pathologically, and genetically with FTLD-TDP [54]. These alterations include abnormal remodelling of the extracellular matrix [8–10, 48, 51, 52], increased angiogenesis [8–10, 48, 51], altered microvascular density and morphology [6, 8, 48], compromised blood brain barrier integrity [5, 8, 47, 50, 52], and abnormal blood flow [48, 49]. Among these mechanisms, remodelling of the vascular wall extracellular matrix could alter the stiffness of cortical arterioles and lower the threshold for arteriolar buckling [46], in addition to the possible effects of neuropil rarefaction discussed above. Alternatively, the increased raspberry density in FTLD could be a manifestation of abnormal angiogenesis and arterialisation, as previously hypothesised due to the increased raspberry density in vascular dementia [24]. Our exploratory analyses of the raspberry density in FTLD in relation to proteinopathy and specific diagnosis were inconclusive. Looking at the descriptive data, the raspberry density in FTLD-TDP was slightly higher than in FTLD-tau, but the FTLD-TDP group also exhibited more severe cortical atrophy. Among the FTLD-tau and -TDP subgroups, the highest raspberry density was found in FTLD-TDP type B. Among the eight patients with a documented C9orf72 mutation, six manifested as FTLD-TDP type B (one of these cases also had tau pathology), and the other two as type A. As a group, these eight patients exhibited a notably high raspberry density (median 11.6 raspberries/cm², compared to 7.1 raspberries/cm² for the entire FTLD group). Due to the low number of known C9orf72 mutation carriers and large proportion of individuals with unknown genetic status in our study population, the relevance of this observation is unclear. Interestingly, individuals with a C9orf72 mutation exhibit a presymptomatic decline in cerebral blood flow that may be less dependent on brain atrophy compared to GRN and MAPT mutation carriers [55], and a recent experimental study indicated that endothelial cells derived from C9orf72 mutation carriers have an abnormal phenotype that potentially affects the substrate exchange with neurons (other dysfunctional features were also reported [56]). Our results do not indicate an increased frontocortical raspberry density in LBD compared to control cases. It is possible that the pathomechanisms of LBD simply do not induce raspberry formation. Alternatively, raspberry formation could be partially inhibited by anti-angiogenic effects of alpha-synuclein accumulation [21]. It should be noted that hypoperfusion of the occipital lobes is considered characteristic of LBD [57]; however, the hypoperfusion in LBD is often more widespread and involve also the frontal lobes [58, 59]. As such, we would have expected to detect an increased frontocortical raspberry density in the LBD group if an association between increased raspberry density and LBD were to exist, but an examination of the occipital raspberry density in LBD could be valuable to further explore this relationship. The main limitations of this study are the retrospective design and the semiquantitative assessment of cortical atrophy. Because all autopsies were initiated based on clinical indications, relatively lenient exclusion criteria were deemed necessary to acquire a sufficiently large study sample. Consequently, a proportion of the control cases exhibited neuropathological comorbidity that could affect the external validity, although importantly, the raspberry density of cases with neuropathological comorbidity was similar to that of cases with no such findings (with the exception of the single case with traumatic brain injury; Table 2). Ordinal ranking of cortical atrophy was considered less dependent on sample orientation than measuring cortical thickness. With this semiquantitative approach, a difference in raspberry density beyond what may be explained by cortical atrophy was indicated, but the comparison between FTLD and control cases was statistically inconclusive, and our results also indicated a potential correlation between raspberry density and cortical atrophy. As such, an assessment of the raspberry density in FTLD in relation to a quantitative measure of cortical atrophy is motivated to validate the results. With these limitations in mind, the study adds to previous findings of increased raspberry density in relation to advancing age and vascular dementia, potentially indicating that various underlying causes may converge in increased raspberry formation. The study does not enable conclusions on whether the raspberry density is higher within a certain part of the FTLD spectrum. However, given the lack of association between raspberry density and LBD, altered raspberry density may not be a general feature of neurodegenerative disease. Future studies are needed to determine whether increased raspberry density in FTLD could function as a marker for more widespread vascular alterations, by examining the raspberry density in FTLD in relation to overall vascular density, protein aggregates in the vascular wall, signs of compromised blood brain barrier, or altered extracellular matrix deposition. An examination of the raspberry density in other conditions that manifest with tau or TDP43 pathology may also be motivated. Declarations Ethics statement The study was approved by the Swedish Ethical Review Authority, application number 2019-00080 and amendments number 2021-05753-02 and 2023-03097-02. Conflicts of interest statement The authors declare no conflicts of interest. Funding statement The study was supported by Lund University, Region Skane, and the Trolle-Wachtmeister Foundation for Medical Research. Acknowledgements The authors extend their gratitude to the staff at Clinical Genetics, Pathology, and Molecular Diagnostics, Region Skane, Lund, for invaluable technical assistance throughout the project. References 1. Mackenzie IRA, Neumann M, Bigio EH, Cairns NJ, Alafuzoff I, Kril J, et al. Nomenclature for neuropathologic subtypes of frontotemporal lobar degeneration: consensus recommendations. Acta Neuropathologica. 2009;117(1):15-8. https://doi.org/10.1007/s00401-008-0460-5 2. Mackenzie IRA, Neumann M, Bigio EH, Cairns NJ, Alafuzoff I, Kril J, et al. Nomenclature and nosology for neuropathologic subtypes of frontotemporal lobar degeneration: an update. Acta Neuropathologica. 2010;119(1):1-4. https://doi.org/10.1007/s00401-009-0612-2 3. De Reuck JL, Deramecourt V, Cordonnier C, Leys D, Pasquier F, Maurage CA. Cerebrovascular lesions in patients with frontotemporal lobar degeneration: a neuropathological study. Neurodegenerative Diseases. 2012;9(4):170-5. https://doi.org/10.1159/000335447 4. Lin WL, Castanedes-Casey M, Dickson DW. Transactivation response DNA-binding protein 43 microvasculopathy in frontotemporal degeneration and familial Lewy body disease. Journal of Neuropathology & Experimental Neurology. 2009;68(11):1167-76. https://doi.org/10.1097/NEN.0b013e3181baacec 5. De Reuck J, Devos D, Moreau C, Auger F, Durieux N, Deramecourt V, et al. Topographic distribution of brain iron deposition and small cerebrovascular lesions in amyotrophic lateral sclerosis and in frontotemporal lobar degeneration: a post-mortem 7.0-tesla magnetic resonance imaging study with neuropathological correlates. Acta Neurologica Belgica. 2017;117(4):873-8. https://doi.org/10.1007/s13760-017-0832-5 6. Ferrer I, Andrés-Benito P, Zelaya MV, Aguirre MEE, Carmona M, Ausín K, et al. Familial globular glial tauopathy linked to MAPT mutations: molecular neuropathology and seeding capacity of a prototypical mixed neuronal and glial tauopathy. Acta Neuropathologica. 2020;139(4):735-71. https://doi.org/10.1007/s00401-019-02122-9 7. Ferrer I, Andrés-Benito P, Carmona M, Assialioui A, Povedano M. TDP-43 Vasculopathy in the Spinal Cord in Sporadic Amyotrophic Lateral Sclerosis (sALS) and Frontal Cortex in sALS/FTLD-TDP. Journal of Neuropatho-logy & Experimental Neurology. 2021;80(3):229-39. https://doi.org/10.1093/jnen/nlaa162 8. Gerrits E, Giannini LAA, Brouwer N, Melhem S, Seilhean D, Le Ber I, et al. Neurovascular dysfunction in GRN-associated frontotemporal dementia identified by single-nucleus RNA sequencing of human cerebral cortex. Nature Neuroscience. 2022;25(8):1034-48. https://doi.org/10.1038/s41593-022-01124-3 9. Hasan R, Humphrey J, Bettencourt C, Newcombe J, Lashley T, Fratta P, et al. Transcriptomic analysis of frontotemporal lobar degeneration with TDP-43 pathology reveals cellular alterations across multiple brain regions. Acta Neuropathologica. 2022;143(3):383-401. https://doi.org/10.1007/s00401-021-02399-9 10. Pottier C, Mateiu L, Baker MC, DeJesus-Hernandez M, Teixeira Vicente C, Finch NA, et al. Shared brain transcriptomic signature in TDP-43 type A FTLD patients with or without GRN mutations. Brain : a journal of neurology. 2022;145(7):2472-85. https://doi.org/10.1093/brain/awab437 11. McKeith IG, Dickson DW, Lowe J, Emre M, O'Brien JT, Feldman H, et al. Diagnosis and management of dementia with Lewy bodies: third report of the DLB Consortium. Neurology. 2005;65(12):1863-72. https://doi.org/10.1212/01.wnl.0000187889.17253.b1 12. McKeith IG, Boeve BF, Dickson DW, Halliday G, Taylor JP, Weintraub D, et al. Diagnosis and management of dementia with Lewy bodies: Fourth consensus report of the DLB Consortium. Neurology. 2017;89(1):88-100. https://doi.org/10.1212/wnl.0000000000004058 13. De Reuck J, Deramecourt V, Cordonnier C, Leys D, Pasquier F, Maurage CA. Prevalence of cerebrovascular lesions in patients with Lewy body dementia: a neuropathological study. Clinical Neurology and Neurosurgery. 2013;115(7):1094-7. https://doi.org/10.1016/j.clineuro.2012.11.005 14. Javanshiri K, Haglund M, Englund E. Cardiovascular Disease, Diabetes Mellitus, and Hypertension in Lewy Body Disease: A Comparison with Other Dementia Disorders. Journal of Alzheimer's Disease : JAD. 2019;71(3):851-9. https://doi.org/10.3233/jad-190485 15. Allan LM, Ballard CG, Allen J, Murray A, Davidson AW, McKeith IG, et al. Autonomic dysfunction in dementia. Journal of Neurology, Neurosurgery, and Psychiatry. 2007;78(7):671-7. https://doi.org/10.1136/jnnp.2006.102343 16. Andersson M, Hansson O, Minthon L, Ballard CG, Londos E. The period of hypotension following orthostatic challenge is prolonged in dementia with Lewy bodies. International Journal of Geriatric Psychiatry. 2008;23(2):192-8. https://doi.org/10.1002/gps.1861 17. Hase Y, Polvikoski TM, Firbank MJ, Craggs LJL, Hawthorne E, Platten C, et al. Small vessel disease pathological changes in neurodegenerative and vascular dementias concomitant with autonomic dysfunction. Brain Pathology. 2020;30(1):191-202. https://doi.org/10.1111/bpa.12769 18. Tiraboschi P, Hansen LA, Alford M, Merdes A, Masliah E, Thal LJ, et al. Early and widespread cholinergic losses differentiate dementia with Lewy bodies from Alzheimer disease. Archives of General Psychiatry. 2002; 59(10):946-51. https://doi.org/10.1001/archpsyc.59.10.946 19. Claassen JA, Jansen RW. Cholinergically mediated augmentation of cerebral perfusion in Alzheimer's disease and related cognitive disorders: the cholinergic-vascular hypothesis. The Journals of Gerontology. Series A, Biological Sciences and Medical Sciences. 2006; 61(3):267-71. https://doi.org/10.1093/gerona/61.3.267 20. Shimada H, Hirano S, Shinotoh H, Aotsuka A, Sato K, Tanaka N, et al. Mapping of brain acetylcholinesterase alterations in Lewy body disease by PET. Neurology. 2009;73(4):273-8. https://doi.org/10.1212/WNL.0b013e3181ab2b58 21. Miners S, Moulding H, de Silva R, Love S. Reduced vascular endothelial growth factor and capillary density in the occipital cortex in dementia with Lewy bodies. Brain Pathology. 2014;24(4):334-43. https://doi.org/10.1111/bpa.12130 22. Guan J, Pavlovic D, Dalkie N, Waldvogel HJ, O'Carroll SJ, Green CR, et al. Vascular degeneration in Parkinson's disease. Brain Pathology. 2013;23(2):154-64. https://doi.org/10.1111/j.1750-3639.2012.00628.x 23. Hase Y, Ding R, Harrison G, Hawthorne E, King A, Gettings S, et al. White matter capillaries in vascular and neurodegenerative dementias. Acta Neuropathologica Communications. 2019;7(1):16. https://doi.org/10.1186/s40478-019-0666-x 24. Ek Olofsson H, Englund E. A cortical microvascular structure in vascular dementia, Alzheimer's disease, frontotemporal lobar degeneration and nondemented controls: a sign of angiogenesis due to brain ischaemia? Neuropathology and Applied Neurobiology. 2019; 45(6):557-69. https://doi.org/10.1111/nan.12552 25. Ek Olofsson H, Haglund M, Englund E. Are cortical microvascular raspberries caused by cerebral hypoperfusion? An exploratory pathological study. Cerebral Circulation - Cognition and Behavior. 2021;2:100026. https://doi.org/10.1016/j.cccb.2021.100026 26. Ek Olofsson H, Haglund M, Englund E. On the regional distribution of cerebral microvascular ‘raspberries’ and their association with cerebral atherosclerosis and acute circulatory failure. Cerebral Circulation - Cognition and Behavior. 2023:100157. https://doi.org/10.1016/j.cccb.2023.100157 27. Ek Olofsson H, Österling Delshammar T, Englund E. Cortical microvascular raspberries and ageing: an independent but not exclusive relationship. Acta Neuropathologica Communications. 2023;11(1):195. https://doi.org/10.1186/s40478-023-01700-z 28. Ighodaro ET, Shahidehpour RK, Bachstetter AD, Abner EL, Nelson RS, Fardo DW, et al. A neuropathologic feature of brain aging: multi-lumen vascular profiles. Acta Neuropathologica Communications. 2023;11(1):138. https://doi.org/10.1186/s40478-023-01638-2 29. Hassler O. Vascular changes in senile brains. A micro-angiographic study. Acta Neuropathologica. 1965;5(1):40-53. https://doi.org/10.1007/bf00689161 30. Hassler O. Arterial deformities in senile brains. The occurrence of the deformities in a large autopsy series and some aspects of their functional significance. Acta Neuropathologica. 1967;8(3):219-29. https://doi.org/10.1007/bf00688824 31. Cervos-Navarro J, Gertz HJ, Frydl V. Cerebral blood vessel changes in old people. Mechanisms of Ageing and Development. 1987;39(3):223-31. https://doi.org/10.1016/0047-6374(87)90062-5 32. Arsene D, Ardeleanu C. Vascular convolutes in the brain: a peculiar entity. Romanian Journal of Morphology and Embryology. 2006; 47(1):37-41. PMID: 16838055 33. Zimmerman B, Rypma B, Gratton G, Fabiani M. Age-related changes in cerebrovascular health and their effects on neural function and cognition: A comprehensive review. Psychophysiology. 2021;58(7): e13796. https://doi.org/10.1111/psyp.13796 34. Xu X, Wang B, Ren C, Hu J, Greenberg DA, Chen T, et al. Age-related Impairment of Vascular Structure and Functions. Aging and Disease. 2017;8(5):590-610. https://doi.org/10.14336/ad.2017.0430 35. Lowe J, Kalaria R. Dementia. In: Love S, Budka H, Ironside JW, Perry A, editors. Greenfield's Neuropathology. 9 ed2015. https://doi.org/10.1201/9781315382715 36. Brunnström H, Englund E. Clinicopathological concordance in dementia diagnostics. The American Journal of Geriatric Psychiatry. 2009;17(8):664-70. https://doi.org/10.1097/jgp.0b013e3181a6516e 37. McKhann GM, Albert MS, Grossman M, Miller B, Dickson D, Trojanowski JQ. Clinical and pathological diagnosis of frontotemporal dementia: report of the Work Group on Frontotemporal Dementia and Pick's Disease. Archives of Neurology. 2001;58(11):1803-9. https://doi.org/10.1001/archneur.58.11.1803 38. Cairns NJ, Bigio EH, Mackenzie IRA, Neumann M, Lee VMY, Hatanpaa KJ, et al. Neuropathologic diagnostic and nosologic criteria for frontotemporal lobar degeneration: consensus of the Consortium for Frontotemporal Lobar Degeneration. Acta Neuropathologica. 2007; 114(1):5-22. https://doi.org/10.1007/s00401-007-0237-2 39. Mackenzie IRA, Neumann M, Baborie A, Sampathu DM, Du Plessis D, Jaros E, et al. A harmonized classification system for FTLD-TDP pathology. Acta Neuropathologica. 2011;122(1):111-3. https://doi.org/10.1007/s00401-011-0845-8 40. Lee EB, Porta S, Michael Baer G, Xu Y, Suh E, Kwong LK, et al. Expansion of the classification of FTLD-TDP: distinct pathology associated with rapidly progressive frontotemporal degeneration. Acta Neuropathologica. 2017;134(1):65-78. https://doi.org/10.1007/s00401-017-1679-9 41. Blevins BL, Vinters HV, Love S, Wilcock DM, Grinberg LT, Schneider JA, et al. Brain arteriolosclerosis. Acta Neuropathologica. 2021;141(1):1-24. https://doi.org/10.1007/s00401-020-02235-6 42. Crary JF, Trojanowski JQ, Schneider JA, Abisambra JF, Abner EL, Alafuzoff I, et al. Primary age-related tauopathy (PART): a common pathology associated with human aging. Acta Neuropathologica. 2014; 128(6):755-66. https://doi.org/10.1007/s00401-014-1349-0 43. Braak H, Braak E. Neuropathological stageing of Alzheimer-related changes. Acta Neuropathologica. 1991;82(4):239-59. https://doi.org/10.1007/bf00308809 44. Braak H, Alafuzoff I, Arzberger T, Kretzschmar H, Del Tredici K. Staging of Alzheimer disease-associated neurofibrillary pathology using paraffin sections and immunocytochemistry. Acta Neuropathologica. 2006;112(4):389-404. https://doi.org/10.1007/s00401-006-0127-z 45. Sergeant, ESG, 2018. Epitools Epidemiological Calculators. Ausvet. [cited 2023 1 June]. Available from: http://epitools.ausvet.com.au 46. Han HC. Twisted blood vessels: symptoms, etiology and biomechanical mechanisms. Journal of Vascular Research. 2012; 49(3):185-97.https://doi.org/10.1159/000335123 47. Blair LJ, Frauen HD, Zhang B, Nordhues BA, Bijan S, Lin YC, et al. Tau depletion prevents progressive blood-brain barrier damage in a mouse model of tauopathy. Acta Neuropathologica Communications. 2015;3:8. https://doi.org/10.1186/s40478-015-0186-2 48. Bennett RE, Robbins AB, Hu M, Cao X, Betensky RA, Clark T, et al. Tau induces blood vessel abnormalities and angiogenesis-related gene expression in P301L transgenic mice and human Alzheimer's disease. Proceedings of the National Academy of Sciences of the United States of America. 2018;115(6):E1289-e98. https://doi.org/10.1073/pnas.1710329115 49. Park L, Hochrainer K, Hattori Y, Ahn SJ, Anfray A, Wang G, et al. Tau induces PSD95-neuronal NOS uncoupling and neurovascular dysfunction independent of neurodegeneration. Nature Neuroscience. 2020;23(9):1079-89. https://doi.org/10.1038/s41593-020-0686-7 50. Zamudio F, Loon AR, Smeltzer S, Benyamine K, Navalpur Shanmugam NK, Stewart NJF, et al. TDP-43 mediated blood-brain barrier permeability and leukocyte infiltration promote neurodegeneration in a low-grade systemic inflammation mouse model. Journal of Neuroinflammation. 2020;17(1):283. https://doi.org/10.1186/s12974-020-01952-9 51. Hipke K, Pitter B, Hruscha A, van Bebber F, Modic M, Bansal V, et al. Loss of TDP-43 causes ectopic endothelial sprouting and migration defects through increased fibronectin, vcam 1 and integrin α4/β1. Frontiers in Cell and Developmental Biology. 2023;11:1169962. https://doi.org/10.3389/fcell.2023.1169962 52. Arribas V, Onetti Y, Ramiro-Pareta M, Villacampa P, Beck H, Alberola M, et al. Endothelial TDP-43 controls sprouting angiogenesis and vascular barrier integrity, and its deletion triggers neuroinflammation. Journal of Clinical Investigation Insight. 2024;9(5). https://doi.org/10.1172/jci.insight.177819 53. Garbuzova-Davis S, Rodrigues MC, Hernandez-Ontiveros DG, Louis MK, Willing AE, Borlongan CV, et al. Amyotrophic lateral sclerosis: a neurovascular disease. Brain Research. 2011;1398:113-25. https://doi.org/10.1016/j.brainres.2011.04.049 54. Neumann M. Frontotemporal lobar degeneration and amyotrophic lateral sclerosis: molecular similarities and differences. Revue Neurologique. 2013;169(10):793-8. https://doi.org/10.1016/j.neurol.2013.07.019 55. Mutsaerts H, Mirza SS, Petr J, Thomas DL, Cash DM, Bocchetta M, et al. Cerebral perfusion changes in presymptomatic genetic frontotemporal dementia: a GENFI study. Brain : A Journal of Neurology. 2019;142(4):1108-20. https://doi.org/10.1093/brain/awz039 56. Aragón-González A, Shaw AC, Kok JR, Roussel FS, Santos Souza CD, Granger SM, et al. C9ORF72 patient-derived endothelial cells drive blood-brain barrier disruption and contribute to neurotoxicity. Fluids and Barriers of the CNS. 2024;21(1):34. https://doi.org/10.1186/s12987-024-00528-6 57. Lobotesis K, Fenwick JD, Phipps A, Ryman A, Swann A, Ballard C, et al. Occipital hypoperfusion on SPECT in dementia with Lewy bodies but not AD. Neurology. 2001;56(5):643-9. https://doi.org/10.1212/wnl.56.5.643 58. Fong TG, Inouye SK, Dai W, Press DZ, Alsop DC. Association cortex hypoperfusion in mild dementia with Lewy bodies: a potential indicator of cholinergic dysfunction? Brain Imaging and Behavior. 2011;5(1):25-35. https://doi.org/10.1007/s11682-010-9108-x 59. Binnewijzend MA, Kuijer JP, van der Flier WM, Benedictus MR, Möller CM, Pijnenburg YA, et al. Distinct perfusion patterns in Alzheimer's disease, frontotemporal dementia and dementia with Lewy bodies. European Radiology. 2014;24(9):2326-33. https://doi.org/10.1007/s00330-014-3172-3
Copyright: © 2025 The author(s). This is an open access article distributed under the terms of the Creative Commons Attribution 4.0 International License ( https://creativecommons.org/licenses/by/4.0/ ), which permits unrestricted use, distribution, and reproduction in any medium, provided the original author and source are credited, a link to the Creative Commons license is provided, and any changes are indicated. The Creative Commons Public Domain Dedication waiver ( https://creativecommons.org/publicdomain/zero/1.0/ ) applies to the data made available in this article, unless otherwise stated. |
||||||||||||||||||||||||||||||||||||||||||||||||||||||||||||||||||||||||||||||||||||||||||||||||||||||||||||||||||||||||||||||||||||||||||||||||||||||||||||||