|
|
|||||||||||||||||||||||||||||||||||||||||||||||||||||||||
|
Free Neuropathology 6:4 (2025) |
|||||||||||||||||||||||||||||||||||||||||||||||||||||||||
|
Original Paper |
|||||||||||||||||||||||||||||||||||||||||||||||||||||||||
|
Preservation of cellular structure via immersion fixation in brain banking |
|||||||||||||||||||||||||||||||||||||||||||||||||||||||||
|
Macy Garrood1, Emma L. Thorn2,3, Adam Goldstein2,3, Allison Sowa4, William Janssen4, Alyssa Wilson5, Claudia S. López6,7, Raakhee Shankar6, Erin S. Stempinski6, Kurt Farrell2,3, John F. Crary2,3, Andrew T. McKenzie1† |
|||||||||||||||||||||||||||||||||||||||||||||||||||||||||
|
|||||||||||||||||||||||||||||||||||||||||||||||||||||||||
|
Corresponding author: |
|||||||||||||||||||||||||||||||||||||||||||||||||||||||||
|
Submitted: 18 November 2024 |
|||||||||||||||||||||||||||||||||||||||||||||||||||||||||
|
Keywords: Brain banking, Immersion fixation, Histology quality, Postmortem interval, Myelin, Synapse, Vacuolization, Volume electron microscopy |
|||||||||||||||||||||||||||||||||||||||||||||||||||||||||
|
Abstract Immersing the brain in a solution containing formaldehyde is a commonly used method for preserving the structure of human brain tissue in brain banking. However, there are questions about the quality of preservation using this method, as formaldehyde takes a relatively long period of time to penetrate a large organ such as the human brain. As a result, there is a critical need to determine whether immersion fixation is an adequate initial preservation method. To address this, we present exploratory histologic findings from our brain bank following the immersion fixation of hemi-sectioned brain specimens under refrigeration. Using light microscopy, we found that there was no significant change in the size of pericellular or perivascular rarefaction areas based on the postmortem interval (PMI) or on the progression from the outer (frontal cortex) to the inner (striatum) brain regions. Additionally, we did not identify any significant number of ghost cells – a state of late-stage cellular necrosis – in the light micrographs analyzed. Using transmission electron microscopy of tissue from the frontal cortex, we found that synapses could still be visualized, but there was vacuolization and variable degrees of myelin disbanding identified. Using serial section transmission electron microscopy, we found that identified synapses could be traced from one section to the next. Using serial block face scanning electron microscopy, we also found that myelinated axons on 2D images can be traced with high fidelity from one image to the next, even at PMIs of up to 27 hours. Collectively, our data corroborate previous findings that immersion fixation is effective for prevention of cellular necrosis and for visualizing many ultrastructural features in at least the surface areas of the brain. However, how structural preservation quality should best be assessed in brain banking is an open question that depends on the intended research applications. |
|||||||||||||||||||||||||||||||||||||||||||||||||||||||||
|
Abbreviations EM - Electron microscopy, h - Hours, HFW - Horizontal field width, kV - Kilovolts, LHE - Luxol fast blue counterstained with hematoxylin and eosin, PMI - Postmortem interval, ROI - Region of interest, SEM - Scanning electron microscopy, SBF-SEM - Serial block-face scanning electron microscopy, ssTEM - Serial section transmission electron microscopy, TEM - Transmission electron microscopy, WSI - Whole slide image. Introduction High-quality preservation of large samples of brain tissue for subsequent study is critical for many areas, including clinical care, research, and education. Historically, whole brains were often preserved via immersion in solutions containing ethanol (Horsley, 1997; Schweizer et al., 2014). With the first patent for the large-scale production of formaldehyde solutions in 1891, there was considerable interest around that time in the use of formaldehyde as an antiseptic and also as a fixative in pathology (Musiał et al., 2016). By the mid 1890s, formalin – a version of formaldehyde with a small percentage of methanol added for chemical stabilization – had already started to be widely used around the world for brain preservation, because it was found to be so effective in preserving microscopic structure (Fish, 1895; Musiał et al., 2016). Today, immersion of a whole human brain or a hemi-sectioned half brain in formalin is widely used as a first step for many downstream applications. However, the effectiveness of this technique has been a subject of some debate, particularly regarding its capacity to adequately preserve deep brain structures before the cells decompose (Grinberg et al., 2008; McFadden et al., 2019). This concern is heightened in the context of human brain disorders, where precise preservation is essential for accurate clinical diagnosis and research efforts (Yang et al., 2022). As a result, better understanding immersion fixation methods is critical for ensuring the integrity of tissue samples used in neuropathological research, particularly for studies aimed at unraveling the underlying mechanisms of human brain disorders and paving the way for improved treatments. One key alternative to the immersion fixation of whole or hemi-sectioned brain specimens is the use of biopsy samples. Surgical biopsies yield some of the best-preserved human brain tissue and have been used for the largest-scale volume electron microscopy (EM) studies in humans to date (Oost et al., 2023; Shapson-Coe et al., 2024). Researchers have invested considerable effort in optimizing fixation and processing methods for these biopsies, particularly for EM studies (Karlupia et al., 2023; Rollenhagen et al., 2024). The primary advantage of surgical biopsies is the minimal ischemic time, often just minutes between tissue removal and fixation initiation. However, the availability of brain biopsies is limited to specific clinical scenarios requiring surgical intervention. In the autopsy setting, it is also common practice to obtain small biopsy samples of the brain for EM, and often these biopsies are fixed separately in glutaraldehyde (Kay et al., 2013; Sele et al., 2019). This approach also minimizes the ischemic time exposure for that sample of tissue. On the other hand, there are also advantages to using whole or hemi-sectioned brain specimens that have been immersion fixed for EM studies, as this allows for the use of already archived tissue and for histological studies across the entire brain. Another alternative to immersion fixation is perfusion fixation. This involves the pressure-driven delivery of fixative through the vascular system, which can lead to more rapid and uniform tissue preservation. Perfusion fixation has the obvious potential advantage of reducing the time required for fixation, which can be useful for expediting the neuropathologic exam and for preventing overfixation in surface areas (Beach et al., 1987; Adickes et al., 1997; Sharma and Grieve, 2006). Several studies have also reported that perfusion fixation can improve the preservation of histologic features compared to immersion fixation, especially in inner brain regions such as the thalamus and basal ganglia (Grinberg et al., 2008; McFadden et al., 2019). However, this latter finding has not been reported by all studies. One study found no significant difference in staining quality between perfusion- and immersion-fixed brain tissue, provided that immersion fixation was allowed sufficient time to fix the entire brain (Sharma and Grieve, 2006). Some of the reported relative advantages of perfusion fixation may have been accentuated because the control immersion fixation procedures did not use refrigeration during immersion, which has been found to be critical for preservation quality, because it dramatically slows down cellular decomposition (McKee, 1999). Moreover, perfusion fixation is technically more complex, not always available, can introduce tissue edema, and can be ineffective in cases with long PMIs or prolonged agonal states. Taken together, perfusion fixation has potential advantages in certain circumstances, but additional research is also warranted to better characterize immersion fixation. One important question is how quickly formalin penetrates to preserve different parts of the immersed brain. There have been several neuroimaging studies on this topic (Yong-Hing et al., 2005; Dawe et al., 2009; Dadar et al., 2024). However, the time it takes for the fluid to alter imaging parameters is not necessarily the same as the time it takes for preservative chemicals to penetrate the brain tissue to sufficiently slow down cellular decomposition. Moreover, there is an important potential distinction between two timeframes: the initial short time needed for the fixative to enter a region of tissue versus the subsequent longer time required for tissue fixation to be sufficiently crosslinked for downstream histological processing (Helander, 1999). This potential difference is not well studied. Formalin fixation has been found to occur in a manner where time is roughly proportional to the depth penetrated, unlike some other chemicals where time is more proportional to the square root of the depth (Dempster, 1960). One study on rabbit liver tissue found that 10 % formalin fixed a tissue depth of approximately 0.5 cm in 9 h (Dempster, 1960). Another study found that after 24 h of immersion fixation of whole human brains in 20 % formalin at room temperature, formalin had fixed the tissue 1–2 cm from the surface of the brain and adjacent to the ventricles (Scott and MacDonald, 2013). Formalin penetration rates have been reported to become faster with higher temperature, a higher concentration of formaldehyde, and more postmortem decomposition (Dempster, 1960). While penetration speed is of academic interest, the main practical question for histological quality is the degree to which the tissue has degraded prior to the moment when reached by the chemical preservative, which also depends on the rate of postmortem decomposition (Krassner et al., 2023). There have been some empirical studies on the microscopic preservation quality of immersion-fixed brain tissue in non-human animals. Outcomes vary based on the intended research application and the level of structural detail required. Among applications using light microscopy, several studies have reported favorable results. For example, one study found that staining in mouse brains was of acceptable quality whether the tissue was fixed by perfusion or immersion (Wahlsten et al., 2003). Even in extremely large brains such as those of minke whales, researchers reported that immersion fixation resulted in generally good preservation across the brain, with only occasional artifacts observed in inner brain regions (Knudsen et al., 2002). However, for certain types of downstream applications, perfusion fixation has been found to have advantages. One review noted that while immersion fixation is generally sufficient for routine toxicology studies, perfusion fixation is preferred for detailed neurotoxicity investigations (Bolon et al., 2013). Some studies have highlighted specific limitations of immersion fixation for EM. One investigation observed alterations in mitochondrial morphology in large tissue blocks from mouse brains that were fixed via immersion (Hinton et al., 2023), while another reported potential issues with visualizing microvasculature in scanning electron microscopy (SEM) studies due to vessel collapse (Lossinsky and Shivers, 2003). Another study found adequate tissue preservation allowing synaptic quantification in the surface areas of mouse brains, but noted some qualitative artifacts (Monfils et al., 2005). These findings suggest that while immersion fixation can provide adequate preservation for many applications, the choice of the fixation method should be carefully considered based on the specific requirements of each study, particularly when examining ultrastructural details. In the context of human brain banking, there have also been some empirical reports on the preservation quality achieved when using immersion fixation of large tissue specimens. A common finding is that while immersion fixation can preserve certain cellular structures, it may not be optimal for all types of histochemical analyses. For example, one study comparing immersion and perfusion fixation in human brains found that immersion fixation led to decreased parvalbumin staining for fine neural processes and reduced staining for cytochrome oxidase, although Nissl and myelin staining remained unchanged (Wallace et al., 2002). Studies focusing on ultrastructural preservation have yielded mixed results. One group found that synapses could still be visualized in the human cerebral cortex using focused ion beam/scanning EM, even in tissue obtained at autopsy with a PMI of up to 4 h (Cano-Astorga et al., 2021). A separate study reported that immersion fixation of brains in formalin from donors with PMIs of 18 to 50 h led to acceptable ultrastructural quality in the anterior cingulate cortex, with the exception of myelin lamellae splitting (Krause et al., 2016). However, it has also been reported that although vascular morphology is reasonably preserved, cellular organelles can be lost in immersion-fixed human brain tissue (Yamamoto et al., 2013). Despite the widespread use of immersion fixation in brain banking, there remains a critical need to further evaluate its effectiveness in practical brain banking settings. The present study aims to bridge this gap by examining the quality of tissue preservation achieved through immersion fixation of human hemi-sectioned brain specimens under refrigeration. Immersion fixation of hemi-sectioned brain samples is a common practice in brain banking because the other of the two hemispheres is often used non-fixed for cryopreservation. In this study, we employ a multimodal approach, using light microscopy to assess large areas of brain tissue and EM techniques to evaluate detailed histologic features. Our focus is on quantifying the degree of cellular structure preservation in tissues that may not be rapidly fixed via immersion, with particular attention to pericellular and perivascular spaces, cellular necrosis, synapse identification, and myelin integrity. By providing a detailed characterization of preservation quality across different brain regions and various PMIs, our goal is to inform best practices in brain banking and to contribute to better understanding the limitations and capabilities of immersion fixation for various research applications. Methods Brain banking procedures All specimens were obtained and de-identified at the Icahn School of Medicine at Mount Sinai in accordance with its policies, regulations, and institutional review board. The brain hemisphere specimens were preserved with the standard protocol of immersion fixation that has been established in the Neuropathology Brain Bank & Research Core. After extraction, the brain is transported via a plastic bag to the Neuropathology Brain Bank & Research Core. The brainstem and cerebellum are isolated via dissection. The rest of the brain is then sectioned into two hemispheres at the level of the corpus callosum. One hemisphere is immersed in 10 % neutral buffered formalin (Fisher 245–685) under refrigeration at 4 °C for at least two weeks and up to a period of several years. The hemisphere is then dissected into 3–5 mm thick coronal slabs and specific brain regions are sampled for neuropathologic study, as previously described (McKenzie et al., 2022). Eventually, the storage solution is switched to phosphate buffered saline containing 0.1 % sodium azide (Sigma Aldrich, CAS 26628-22-8) for long-term fluid preservation at 4 °C. Light microscopy Brain tissue sampled for light microscopy was placed into cassettes for processing and embedded in paraffin. Next, 5–7 μm thick sections were cut on a microtome, which were mounted on glass slides, deparaffinized, and stained with Luxol fast blue counterstained with hematoxylin and eosin (LHE). Slides were then imaged as whole slide images (WSIs) using a digital slide scanner (Hamamatsu Photonics). Using NDP.view2 software (Hamamatsu Photonics), three representative regions of interest (ROIs) from the gray matter were captured from each WSI for subsequent analysis, attempting to provide coverage of distinct parts of the slide. Our assessment focused on two key indicators of tissue preservation: (a) pericellular/perivascular rarefaction and (b) cellular necrosis (Krassner et al., 2023). Rarefactions were quantified in each ROI by (a) measuring the average of the non-staining pericellular space for at least 3 of the largest cells and (b) measuring the average of the non-staining perivascular space for up to 3 of the largest blood vessels. The maximum width of the pericellular spaces was measured using the measurement tool in NDP.view2. Perivascular spaces were measured at the widest part of the shortest axis using the measurement tool in ImageJ. The presence of late-stage cellular necrosis was assessed in each ROI using a binary (present/absent) grading system. This assessment was based on the identification of a substantial proportion of ghost cells in the ROI by two independent reviewers, which is a characteristic finding of brain tissue in late-stage necrosis (Finnie et al., 2016). Ghost cells were identified by (a) nuclei that are either absent or barely visible, (b) pale staining cytoplasm, and (c) indistinct cell membrane morphology (Finnie et al., 2016). Any grading discrepancies were resolved through a consensus review process among the raters. Electron microscopy For EM, gray matter regions of the frontal cortex from fluid preserved specimens were dissected and further fixed in a solution of 2 % paraformaldehyde and 2 % glutaraldehyde in 0.1 M sodium cacodylate buffer, as previously described (Krassner et al., 2023). A version of the National Center for Microscopy and Imaging Research (NCMIR) protocol was adapted to provide enhanced contrast (Deerinck et al., 2010). This approach uses multiple methods of chemical fixation standard for EM. The brain sample was then dehydrated through a graded ethanol series, infiltrated with Embed 812 epoxy resin (EMS), and polymerized for 72 h at 60 ° C. Semithin sections (0.5 μm) were cut using a Leica UC7 ultramicrotome (Leica, Buffalo Grove, IL) and counterstained with 1 % toluidine blue to identify the regions of interest within layers. Ultra-thin sections of 80 nm thickness were collected onto nickel slot grids (EMS, FCF2010-Ni) and the grids were imaged on an HT7700 transmission electron microscope (TEM) (Hitachi High-Technologies, Tokyo, Japan) using an advantage CCD camera (Advanced Microscopy Techniques, Danvers, MA). Some of the TEM images presented were adjusted for contrast, image size, and with a sharpening filter if needed. Both the raw and adjusted TEM images were made publicly available. For two of the samples, we performed serial section transmission electron microscopy (ssTEM), using ultra-thin sections of 80 nm thickness. Each series consisted of 3 to 10 consecutive sections. The same embedded tissue was also imaged using serial block-face scanning electron microscopy (SBF-SEM). Images were acquired with a pixel size of 10 x 10 x 50 nm3, using a Thermo Fisher Scientific Apreo Volumescope II Serial Block Face SEM. Data from both samples was collected with a horizontal field width (HFW) of 61 μm and an accelerating voltage of 2 kV. Imaging data from one sample had one region of interest and a depth of 25 μm, while imaging data from the other sample was collected with depths of 10 μm and 20 μm, in two regions of interest each. All datasets were aligned and cropped to correct for sample drift using Amira software (Thermo Fisher™). The SBF-SEM datasets were named based on the donor identifier and the area where the images were taken from. The first number was the donor number, and the second number was the depth of the image. L and R correspond to the hemisphere of the frontal lobe. Donor 100 had multiple sets of images taken, from two different depths (10 μm and 20 μm), and from two different representative regions at each depth. EM images were viewed with the Fiji distribution of ImageJ as well as with webKnossos (Boergens et al., 2017). Four distinct analyses were conducted on the different types of EM images, measuring myelin disbanding, myelinated axon density, synapse traceability, and myelinated axon traceability. The first two analyses were performed on standard 2D images using ImageJ software. To measure myelin disbanding, we selected the myelinated axon in the image with the thickest myelin sheath and measured the length of this thickest part (adapted from (Sele et al., 2019)). Along this length, we identified segments that appeared distinctly lighter than the surrounding dark myelin and measured their lengths. The percentage of disbanding was then calculated using the formula: (Sum of light segment lengths / Total measured length) × 100. For myelinated axon density, we outlined each myelinated axon in the image and calculated the area of each outlined axon using ImageJ. We then summed the areas of all myelinated axons and calculated the density as (Total area of myelinated axons / Total image area) × 100. The next two analyses, on synapses and myelinated axons, were performed on the serial section TEM and SBF-SEM data sets, respectively. Synapses within the serial sections were chosen for analysis based on having clear visibility of synaptic structures and the ability to identify both the beginning and end of the synapse within consecutive sections. Synaptic cleft length and width measurements were performed using ImageJ software. These measurements were then multiplied by the known section thickness (80 nm) to calculate the synaptic volume per image in cubic nanometers and then converted to cubic micrometers (adapted from (Bloss et al., 2013)). The total synaptic cleft volume was determined by summing the calculated volumes across all relevant sections. For the traceability analysis on myelinated axons, the SBF-SEM data was uploaded to webKnossos for analysis. Myelinated axons were identified by their characteristic dark banding and then traced to the last image containing the axon. Specifically, using the skeleton tool on webKnossos, the axon was traced until the axon ended or there were no longer any images containing the axon. Results Light microscopy We studied a convenience sample of n = 40 brains from the Mount Sinai Neuropathology Brain Bank & Research CoRE. The age range was from 33 to 87 years (mean = 65.4 years), the PMI ranged from 9.1 to 81.1 h (mean = 26.5 h). Neuropathological workups revealed a range of diagnoses including Alzheimer's disease, cerebrovascular disease, and cases with no diagnostic abnormality recognized. We studied LHE-stained WSIs from three brain regions, which had variable coverage across the cohort: the frontal cortex (at least one WSI available in n = 32 or 80.0 % donors), anterior striatum (n = 35, 87.5 %), and posterior striatum (n = 28, 70.0 %). In n = 23 (57.5 %) donors, at least one WSI was available from all three brain regions. These three brain regions were chosen in order to include both a surface area (frontal cortex) as well as inner areas (anterior striatum, posterior striatum) of the hemi-sectioned brain specimen. Our goal was to look for differences in preservation quality associated with the relatively slower fixation achieved in the inner areas. Qualitatively, we found that the overall tissue preservation visible on light microscopy across all examined samples maintained cellular structures that were generally discernible and identifiable (Figure 1). Expected postmortem artifacts were present, especially pericellular rarefactions, perivascular rarefactions, and vacuolization of the parenchyma. Otherwise, the cellular morphology appeared largely as expected across all regions, with neurons, glia, and blood vessels retaining their characteristic shapes. Luxol fast blue staining of myelin was also present across samples. We could not identify clear qualitative differences in the preservation quality between the surface areas (frontal cortex) and the inner areas (anterior and posterior striatum) of the hemi-sectioned brain specimens, although there were inherent differences in cellular morphology between regions that prevented us from performing quantitative comparisons of cell shape or other cellular features as a proxy for preservation quality. In a few cells across all three brain regions, we detected what potential signs of early necrosis, such as partially disrupted membranes, but these were not widespread or common enough to distinguish them from potential artifacts, such as staining inconsistencies or image blurring.
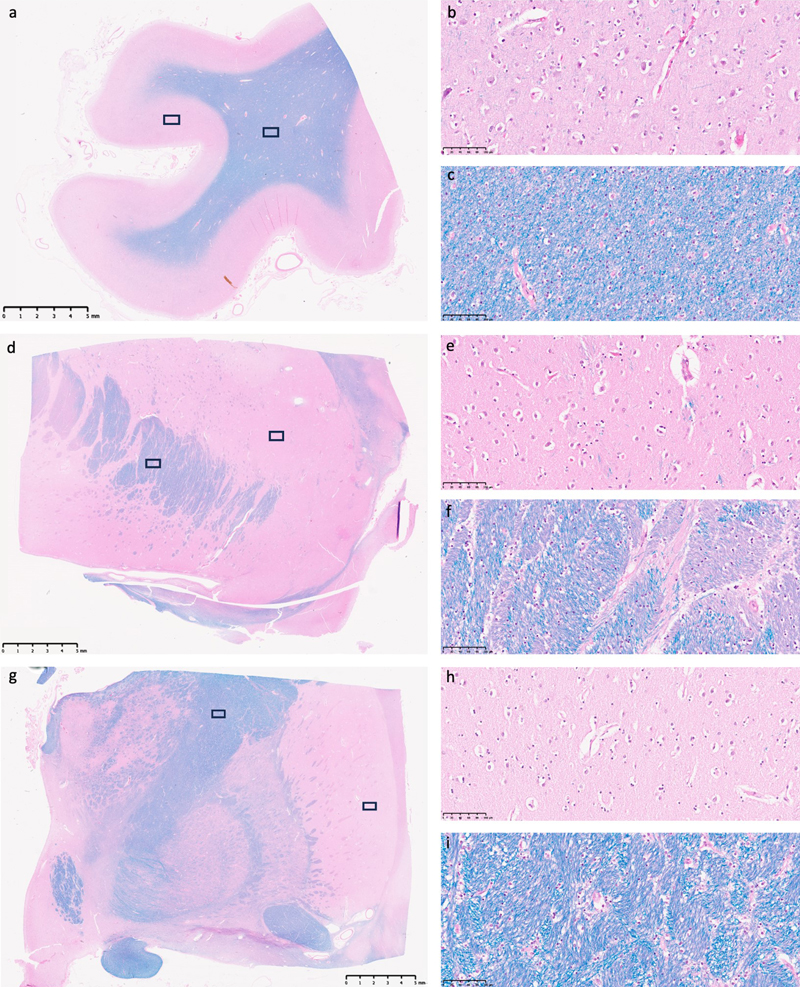
Figure 1. Representative light microscopy images from several brain region studied. LHE-stained tissue sections from the frontal cortex (a–c), anterior striatum (d–f), and posterior striatum (g–i) of an immersion-fixed hemi-sectioned brain specimen. Panel (a) shows a low-magnification overview of the frontal cortex, with black rectangles indicating regions of interest examined at higher magnification in (b) of gray matter and in (c) of white matter. Similar triads of representative images are shown for the anterior striatum (d–f) and the posterior striatum (g–i). All samples were obtained from a 63-year-old male brain donor who died of respiratory failure due to malignant mesothelioma, with a PMI of 23.6 h before tissue preservation. Scale bars in (a, d, and g) are 5 mm; scale bars in higher magnification images are 100 μm. To evaluate for potential late-stage necrosis, two reviewers evaluated the presence of ghost cells in each of three gray matter regions of interest for all the WSIs available. Any given cell may have apparent characteristics of ghost cells, because of problems with staining or visualization, with a preponderance of these aspects at late-stage necrosis (Finnie et al., 2016). Out of the 321 regions of interest (ROIs) analyzed, we identified two ROIs that appeared to potentially have a substantially elevated number of ghost cells, although this may reflect differences in staining or imaging (Figure 2). These two ROIs with elevated numbers of ghost cells were found in samples from the posterior striatum, with PMIs of 53.5 h and 70.5 h. The tissue in these ROIs may represent areas that degraded especially rapidly for an unknown reason, or that may have been differentially affected by an artifact in the processing or imaging procedure. For the other two ROIs from these two samples, there was not a substantial number of ghost cells identified. Taken together, these observations indicate that the immersion fixation procedure generally maintained the histologic architecture on light microscopy as might be expected on a biopsy sample from autopsy brain tissue, with very few or no areas exhibiting substantial cellular necrosis.
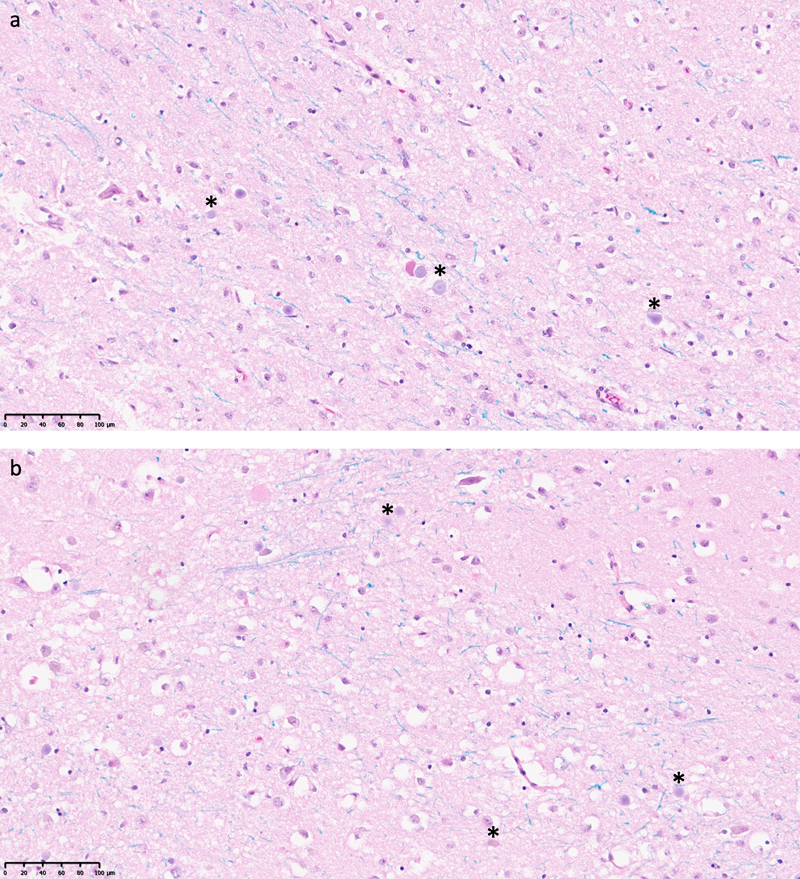
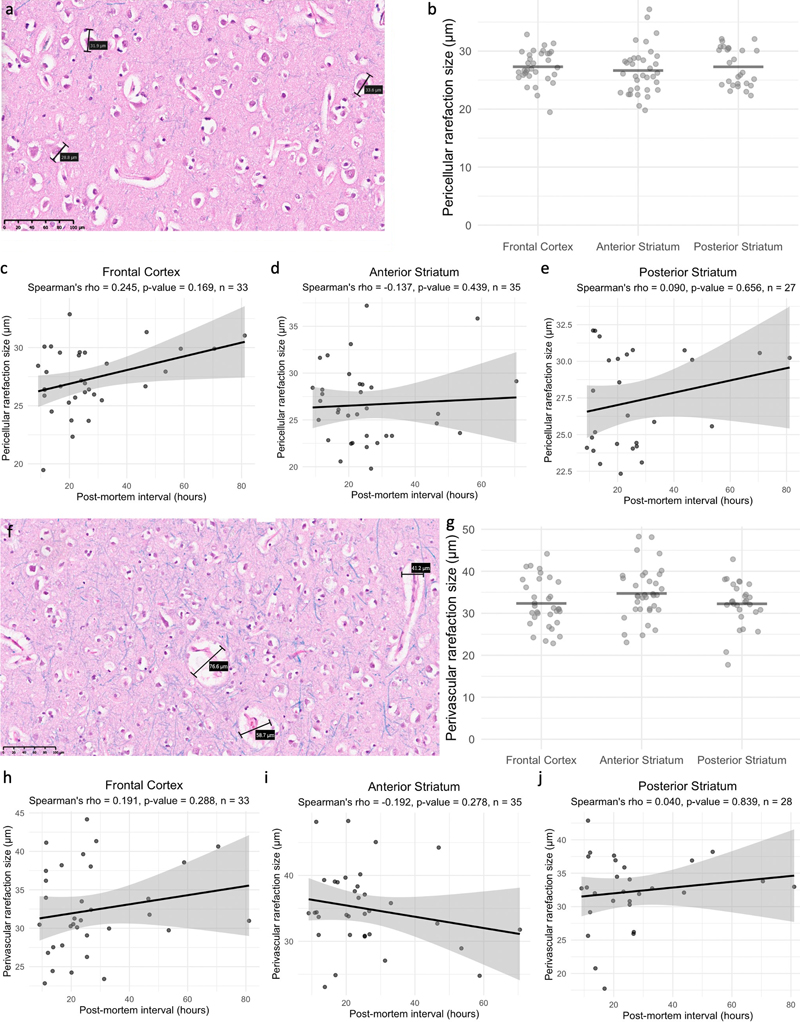
Figure 2. Light microscopy of regions of interest showing a potentially significant number of ghost cells. The regions of interest were classified as having at least three potential ghost cells identified. Ghost cells are characterized by having absent or barely visible nuclei, pale-staining cytoplasm, and indistinct cell membrane morphology. Asterisks indicate cells potentially having these characteristics. It is unclear if staining or imaging factors could also contribute to this appearance. a: LHE-stained tissue section from the posterior striatum of a 62-year-old brain donor, with a PMI of 53.5 h. b: LHE-stained tissue section from the posterior striatum of a 76-year-old brain donor, with a PMI of 70.5 h. Scale bars: 100 μm. To measure whether decomposition might vary quantitatively with PMI or across brain regions, we measured the size of pericellular and perivascular rarefaction areas (Figure 3). These rarefaction areas are common postmortem artifacts that are visible within the early postmortem period and appear to be due to the swelling of tissue elements such as astrocyte processes (Krassner et al., 2023). For each brain region sampled, we determined the arithmetic mean sizes of the pericellular and perivascular rarefaction areas measured across all three of the gray matter regions of interest selected. We found that there was no significant difference between these measures in the surface brain region studied (frontal cortex) and the two inner brain regions studied (anterior striatum and posterior striatum) (Kruskal-Wallis tests: for pericellular rarefaction, H(2) = 1.93, p = 0.381; for perivascular rarefaction, H(2) = 3.71, p = 0.156). We did not identify significant rank correlations between these measures and the PMI in any of the three brain regions studied (all |ρ| < 0.25, p > 0.05). We did find one nominally significant Pearson correlation between the pericellular rarefaction area size and the PMI in the frontal cortex (r = 0.371, p = 0.033), but this became non-significant after adjusting for multiple comparisons using the Benjamini-Hochberg false discovery rate correction (FDR-adjusted p = 0.20). Note that our pericellular and perivascular area measurements may have been influenced by 3D tissue sectioning orientation, independent of postmortem fluid accumulation. That is, it is possible that the visible space around cells and vessels varied based on the angle of the cut during sample preparation. Additionally, it is possible that an effect would have been distinguished with a larger sample size. Acknowledging these potential sources of variability, we did not identify a clear relationship between the measures of rarefaction and either the PMI or the brain region. This finding suggests that while these areas of rarefaction are consistently seen in postmortem brain tissue, they do not seem to be a linear proxy for the duration of ischemia prior to fixation, at least in this data set. These results are consistent with a model in which the rarefactions first occur due to the retrograde flow of cerebrospinal fluid occurring early in the PMI and then remain relatively stable for a period of time (Du et al., 2022; Krassner et al., 2023). It is possible that the rarefaction areas may break down in more advanced decomposition, as the cell membranes of astrocytes and other cell types begin to degrade and therefore allow water to equilibrate across the sample. This phenomenon could then be interpreted as a sign of advanced necrosis. However, we did not observe this phenomenon in the data we analyzed.
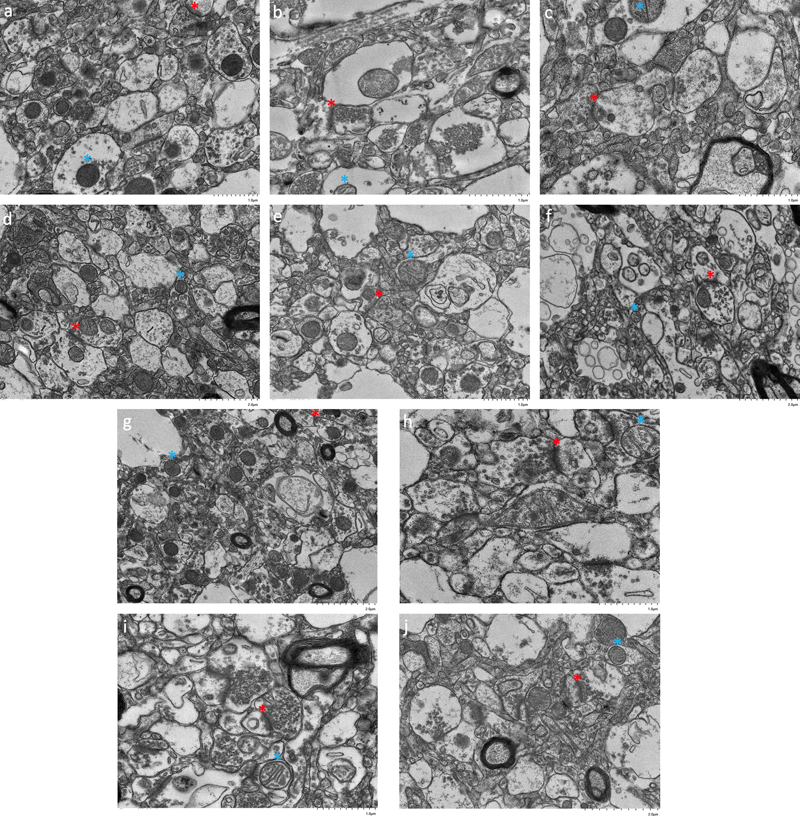
Figure 3. The sizes of pericellular and perivascular rarefaction areas are not significantly different across brain regions nor significantly correlated with the PMI. a: Representative image showing measurements of the three largest pericellular rarefaction areas in a region of interest. Scale bar: 100 μm. b: Distributions of the average sizes of pericellular rarefaction areas in each brain region. Horizontal lines represent arithmetic means. No significant differences were found across brain regions. c–e: Scatter plots showing the PMIs and average pericellular rarefaction size measured for each brain donor across the frontal cortex, anterior striatum, and posterior striatum, respectively. f: Representative image showing sizes of the three largest perivascular rarefaction areas in a region of interest. Scale bar: 100 μm. g: Distributions of average sizes of perivascular rarefaction areas within each brain region. Horizontal lines represent arithmetic means. No significant difference was found across brain regions. h–j: Scatter plots showing the PMIs and average sizes of perivascular rarefaction areas measured for each brain across the frontal cortex, anterior striatum, and posterior striatum, respectively. For all scatter plots, the black lines represent linear regression fits, with gray areas indicating 95 % confidence intervals. Spearman's rho and associated p values are shown for each brain region. 2D electron microscopy Using EM, we studied ten brain donors from the same brain bank (Table 1). We dissected fixed tissue from gray matter of the middle frontal gyrus, a part of the frontal cortex, and performed TEM on the embedded samples. The PMIs of the brains prior to immersion fixation ranged from 10.75 h to 27 h, with an arithmetic mean of 20.6 h. Qualitatively, the TEM images showed expected postmortem artifacts such as vacuolization and some areas with apparently decreased cytoplasmic contrast (Figure 4). However, the images showed that cell membrane contours were largely discernible and maintained much of their expected morphology, despite some potential postmortem alterations. Synapses and mitochondria could be identified in at least one image from all ten samples studied. Notably, the duration of refrigerated fluid preservation prior to sample processing ranged from 0.1 to 3.4 years, with no apparent differences depending on this variable.
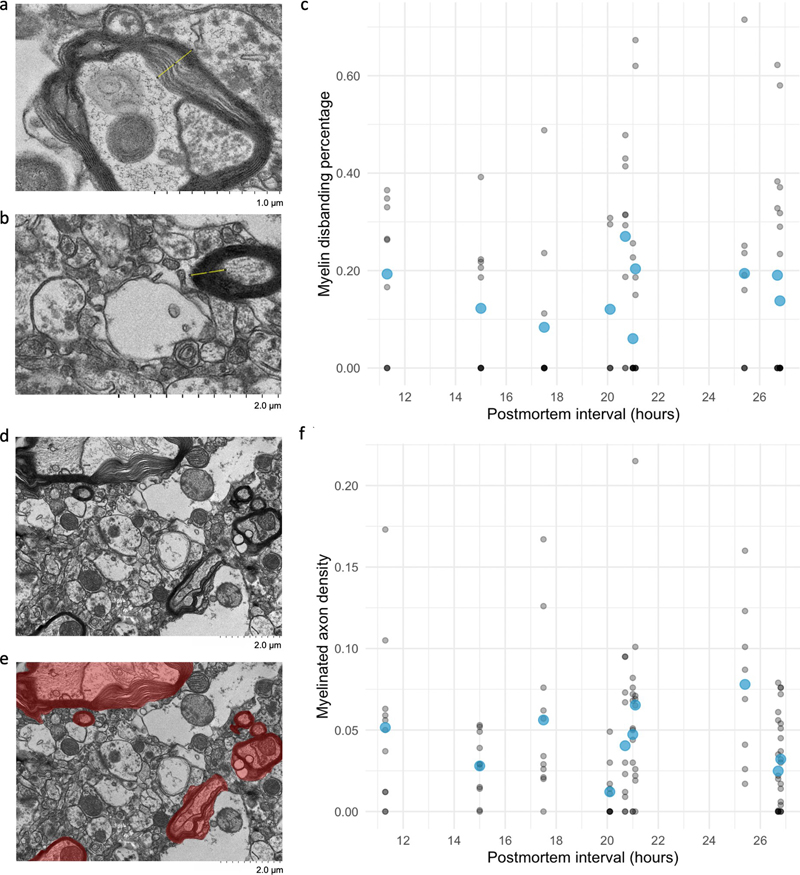
Figure 4. Representative TEM images show qualitative preservation of synapses and mitochondria. All tissues are from the frontal cortex. Asterisks indicate two representative structures: synapses (red) and mitochondria (blue). Donor numbers: 36 (a), 40 (b), 57 (c), 98 (d), 100 (e), 113 (f), 198 (g). 233 (h), 265 (i), 267 (j). Scale bars: a-c, e, h, i: 1 μm; d, f, g, j: 2 μm. Quantitative analysis of the TEM images revealed several findings. Varying degrees of myelin disbanding were seen across samples, a phenomenon known to occur early in the PMI (Krassner et al., 2023). Myelin disbanding was found to be present in 81 % (87/107) of the largest myelinated axons seen in each high-resolution image. The degree of myelin disbanding ranged from 0.0 % to 71.5 % across samples. Note that some degree of myelin disbanding can be present even in EM images from human surgical biopsy specimens that are preserved via immersion fixation (Shapson-Coe et al., 2024). The density of myelinated axons varied across images, ranging from 0 % to 21.5 %, with an average density of 4.2 %. The highest number of myelinated axons identified in one image was eleven. Notably, in the ten brain donors, there was no significant rank correlation between the myelin disbanding percentage or the myelinated axon density and the PMI (myelin disbanding percentage: ρ = 0.21, p = 0.56; myelinated axon density: ρ = 0.006, p = 1.00; Figure 5). These results suggest that while postmortem changes are evident, substantial structural integrity is maintained in many myelinated axons.
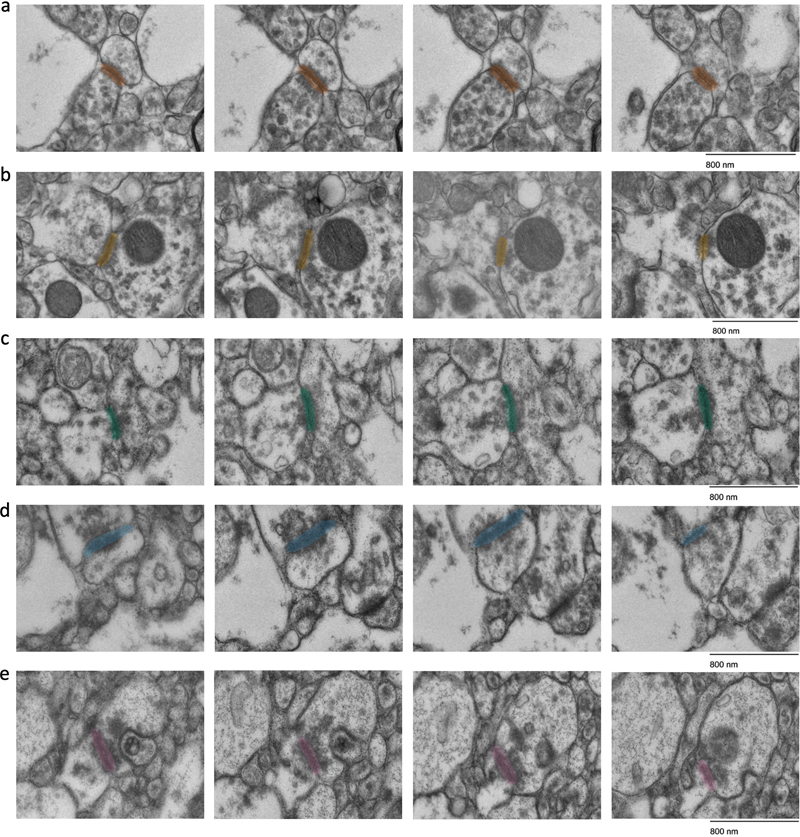
Figure 5. Quantification of the degree of myelin disbanding and the density of myelinated axons in TEM images. a, b: Representative images of myelin disbanding in TEM images, showing examples of highly disbanded (a) and non-disbanded (b) myelin. c: Scatter plot showing the percentage of myelin disbanding and the PMI. Blue points indicate the mean myelin disbanding for each sample; gray points indicate measurements from each individual image. d, e: A representative image with a particularly high density of myelinated axons (d) and the quantification of myelinated axon density in this image (e), i.e. the sum of areas containing myelinated axons (red) divided by the total area. f: Scatter plot showing the myelinated axon density and the PMI. Blue points indicate the mean myelinated axon density for each sample; gray points indicate measurements from each individual image. All points in scatter plots are partially transparent to account for overplotting. Scale bars: 2 μm. Volume electron microscopy To further characterize synaptic preservation, we conducted ssTEM on two samples with PMIs of 26.5 and 27 h. We focused the imaging on cortical layers II/III, which have been found to have a relatively moderate to high synaptic density (Anton-Sanchez et al., 2014). Qualitative analysis of the resulting image stacks revealed that all 18 synapses that met our criteria for tracing could be consistently traced across adjacent sections (Figure 6). To quantify synaptic dimensions, we approximated synaptic cleft volumes by measuring cleft length and width in each section and multiplying this area by the section thickness. The mean synaptic cleft volume was 1.731 × 10⁻³ μm3, with a range of 4.01 × 10⁻³ μm3 to 3.609 × 10⁻³ μm3, and a standard error of the mean of 7.16 × 10⁻⁴ μm3. This substantial variability in synaptic size aligns with previous reports on the variability of synaptic size measurements (Morales et al., 2013; Santuy et al., 2018). It is important to note that our analysis excluded synapses extending beyond the image stack boundaries, with a potential bias of our sample towards smaller synapses. Our ability to trace identified synapses across multiple sections suggests that the structure of the synaptic cleft remains largely intact in these samples, despite the PMI, at least within the subset of synapses we were able to measure.
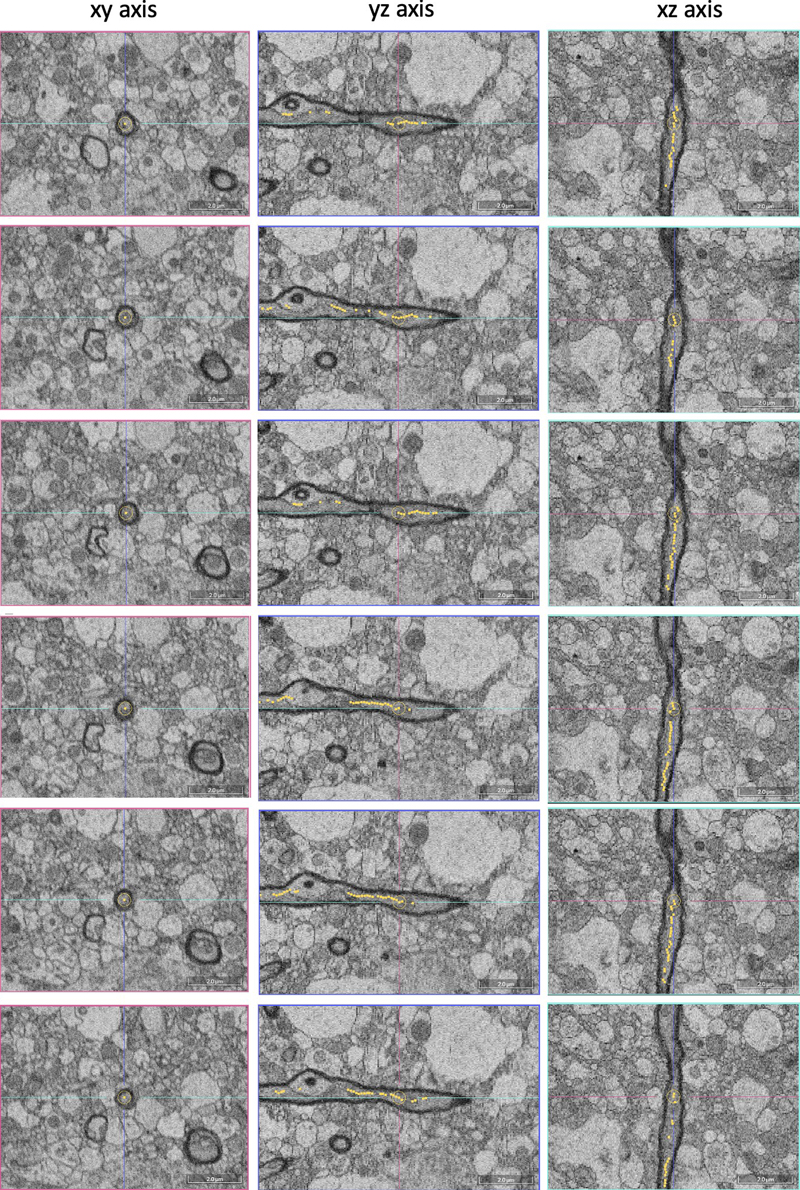
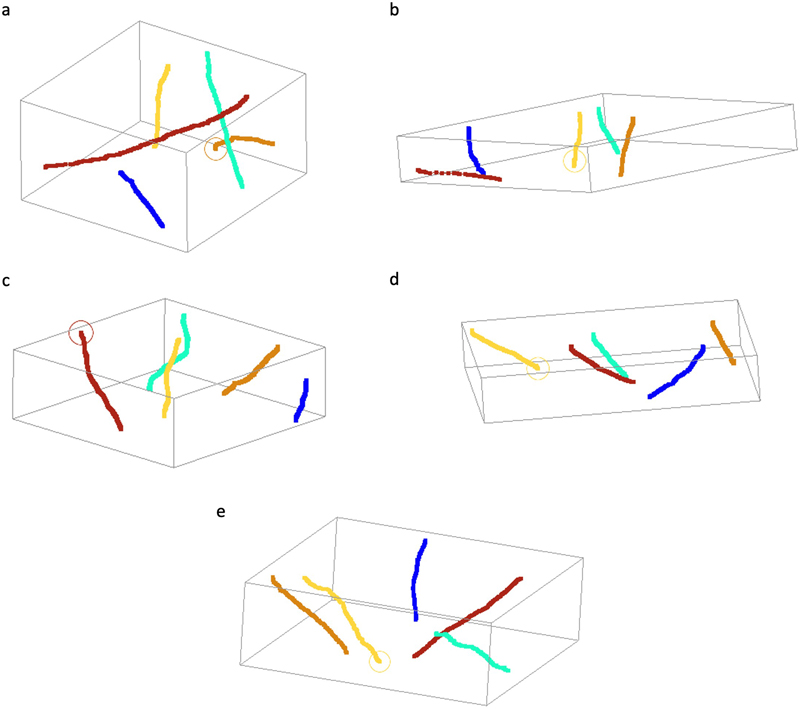
Figure 6. Representative images showing synapses that are traceable in ssTEM images. All synapses are all fully encapsulated in the set of four images. The samples are from donor numbers 36 (a, b) and 233 (c, d, e). Scale bars: 800 nm. To measure the traceability of neural structures over longer distances, we next performed SBF-SEM on two samples (samples 57 and 100, with PMIs of 25 h and 10.75 h respectively). We tested the degree to which myelinated axons could be traced across the available volumes (Figure 7). We found that all 25 myelinated axons that we attempted to trace were easily traceable (Figure 8). Overall, these findings suggest that the 3D structural integrity of myelinated axons is maintained in these immersion-fixed tissue samples, allowing for reliable tracing.
Figure 7. Example of tracing a myelinated axon in the SBF-SEM data set. The images were taken at a depth of 25 μm in donor sample number 57. Scale bars: 2.0 μm.
Figure 8. Skeleton tracings of myelinated axons from SBF-SEM data sets. Tissues were from brain donor numbers 57 (a) and 100 (b, c, d, e). Volumes were imaged at three different depths: 25 μm (a), 20 μm (c, e), and 10 μm (b, d). Discussion In this study, we employed both light and electron microscopy to characterize the histological quality of human hemi-sectioned brain specimens preserved via immersion fixation under refrigeration, which is a common method of brain banking. Our findings demonstrate that immersion fixation can effectively maintain overall tissue architecture and cellular structure. Expected postmortem changes were observed, including pericellular and perivascular rarefaction areas, but the extent of these rarefaction areas did not correlate significantly with the brain region or the PMI over the ranges we studied. We also found that neural structures, including myelinated axons and synapses, remained traceable across volume EM data in samples with PMIs of up to slightly more than 24 h. This observation may help to define an extended time window where EM analyses of autopsy tissue can be effectively performed (Cano-Astorga et al., 2024). Of note, several of our samples were preserved in fluid for more than one year, without any identified effect on cellular morphology, adding to our knowledge about the effects of fluid preservation on brain cell structure (Liu and Schumann, 2014; McKenzie et al., 2024). While perfusion fixation or immersion fixation of small biopsy brain samples may have advantages over immersion fixation, our results suggest that routine immersion fixation of brain tissue may provide sufficient preservation quality for many types of downstream applications. There are many limitations of our current data set and analysis methods, which warrant careful consideration. Measuring histologic preservation quality is indeed a challenging and multifaceted problem. Previous state-of-the-art approaches in this area have tended to be semi-quantitative (Kiernan, 2009; Lindblom et al., 2021). A fundamental issue of our approach is whether our metrics for measuring postmortem decomposition are valid. Using light microscopy, we quantified the pericellular and perivascular rarefaction areas and the presence of ghost cells, which may not necessarily capture the most important postmortem changes. The selection of these metrics was based on our own observations and on previous literature, rather than on an unbiased, comprehensive understanding of the mechanistic alterations that occur in the postmortem brain. We may thus have missed more nuanced changes that may escape the attention of a trained histologist. This limitation underscores the need for more unbiased approaches to assessing tissue preservation. Future research could benefit from employing machine learning algorithms to identify subtle structural and molecular changes that occur during the PMI. For example, with larger sample sizes, it might be possible to use deep learning to discover features that distinguish tissue that has experienced short versus long PMIs in an unbiased manner. Such a project would advance our ability to more objectively measure the loss of preservation quality due to tissue decomposition. EM data presents particular complexities in assessing tissue preservation quality, due to the many potential artifacts or distortions that can be introduced during sample preparation and imaging (Hayat, 1981). It is therefore challenging to distinguish between genuine loss of microstructural integrity in banked brain tissue and artifacts from the assay procedure itself. For example, image blurriness in TEM can be a function of magnification rather than tissue quality. Given these complexities, our EM analysis focused on structures with characteristic appearances, primarily synapses and myelin. We found that myelin, which has been reported to degrade relatively rapidly during the PMI (Krassner et al., 2023), can serve as a practical metric for preservation quality due to its easy identification in EM images. However, this approach has downsides. While measuring myelinated axon density can help bound the degree of tissue degradation, it varies significantly across brain regions and disease states, limiting its standalone utility. Also, while myelin decomposition could theoretically be a proxy for the decomposition of other cell membranes as well, it is difficult to establish this, because other cell membranes have less reliable contrast and a less characteristic form. Ideally, a comprehensive assessment would involve annotating all visible structures, amounting to a type of panoptic segmentation (Peters et al., 1991; Nahirney and Tremblay, 2021; Liu et al., 2024). Developing such tools for EM data would require training on a large set of expertly annotated images from partially degraded brain tissue, a resource that is currently lacking. Moreover, many membrane-bound structures in 2D EM images are ambiguous (e.g., axons, dendrites, or glial processes) and require volume imaging data for identification. These challenges underscore the need for advanced analytical tools and standardized datasets to improve our ability to assess preservation quality in EM studies of imperfectly preserved brain tissue. In volume EM, traceability has emerged as a key metric for assessing the quality of connectome data sets. For example, one study found that finer neural structures are more challenging to trace across sections than larger structures, requiring thinner sections for reliable reconstruction (Hayworth et al., 2015). In our volume EM data sets, we found that both synapses and myelinated axons, which are relatively thicker compared to fine, unmyelinated cell processes, were easily traceable. This suggests that our immersion fixation protocol adequately preserves these thicker structures for potential volumetric analysis. However, it is important to note that our study did not attempt to trace fine, unmyelinated processes, which may be more susceptible to postmortem changes. The traceability of neural structures in volume EM raises another practical question: to what extent can 3D traceability be predicted from 2D images? Based on our qualitative experience analyzing this data, we suspect that the signal-to-noise ratio of cell membranes in individual 2D images may serve as a useful proxy for 3D traceability. However, this hypothesis requires formal testing. Future studies could systematically evaluate the relationship between 2D image quality metrics – such as cell membrane contrast and continuity – and the success rate of 3D tracing in volume EM datasets. Such research could potentially lead to the development of ultrastructural quality assessment tools for brain bank samples, allowing researchers to predict the suitability of tissue for volume EM studies. Another key limitation of our study is the absence of EM data from inner brain regions. Our initial approach was to start with a surface brain region for EM analysis, as we were uncertain about the overall quality of preservation achievable anywhere in the brain using our immersion fixation protocol at the given PMIs. We reasoned that if the surface regions, which are exposed earliest to the fixative, showed poor preservation, it would be necessary to reassess our methods for exploring deeper structures. However, since our approach yielded acceptable preservation quality in the surface region analyzed, important questions about the quality of tissue preservation after immersion fixation can now be addressed in inner brain regions. While some previous data has suggested that ultrastructural quality can be at least acceptable in deeper brain regions (Krause et al., 2016), the existing data on this topic are minimal, so substantial additional data will be required to corroborate these findings across various brain regions and under different fixation conditions. Currently, the extent to which cellular features are altered in deep brain regions when visualized via electron microscopy is not well established. To address this limitation in a separate future publication, we plan to perform similar analyses of ultrastructural preservation quality in multiple inner brain regions. Such data will be critical for understanding the full capabilities and limitations of immersion fixation in brain banking. Over recent years there has been research on new technologies to “unlock” genomic data in specimens preserved in formalin in museum collections around the world (Hahn et al., 2022). Drawing parallels to this research, we propose that it may one day be possible to unlock connectome data from immersion-fixed brain tissue stored in brain banks. The feasibility of this approach likely depends on the degree of artifacts present in the samples, which can vary based on the specific fixation and fluid preservation protocols used (McKenzie et al., 2024). Additionally, realizing this possibility would require substantial advances in embedding long-term fluid-preserved specimens. The duration of ischemia and prolonged storage almost certainly alter the optimal parameters for sample preparation and imaging. Nevertheless, based on our current findings, we suggest that the fundamental structural elements required for connectome analysis may be present in at least a subset of immersion-fixed brains. This is particularly significant given that the vast majority of fixed brain bank specimens have been, and continue to be, preserved using immersion fixation. While technical challenges and scientific questions about feasibility certainly remain, we propose that more exploratory research should be performed on the possibility of leveraging existing brain bank resources for human connectomics studies. Conclusions Our study of immersion-fixed hemi-sectioned brain specimens provides evidence that this brain banking method results in adequate preservation of cellular and subcellular structures, even at PMIs that are commonly achievable in brain banking. Light microscopy revealed generally well-maintained tissue architecture, with no significant correlation between the measured features of decomposition and the PMI or the brain region. EM demonstrated the preservation of characteristic ultrastructural features, including traceable synapses and myelinated axons in volume imaging. While expected postmortem changes such as vacuolization and myelin disbanding were observed, these did not preclude the identification and analysis of critical neural structures. Our findings suggest that immersion-fixed brain bank specimens may be suitable for a wider range of research applications than commonly recognized, potentially including connectomics studies. However, we acknowledge the limitations of our current metrics for assessing preservation quality and the need for more sophisticated, unbiased approaches. We suggest that future research should focus on developing advanced analytical tools for measuring tissue integrity, expanding ultrastructural analyses to deeper brain regions, and exploring the potential for profiling volume EM data from archival brain bank specimens. As our understanding of postmortem tissue preservation advances, we may unlock new ways to leverage brain bank resources to elucidate the mechanisms of neurobiological disorders. Author contributions M.G., K.F., J.C., and A.T.M. conceptualized the article. A.S., W.J., J.C., and A.T.M. designed the electron microscopy experiments. A.T.M. performed article searching and screening. E.T. performed light microscopy experiments. A.S., W.J., C.S.L., R.S., and E.S.S. performed electron microscopy experiments. M.G., A.G., A.W., and A.T.M. performed data analysis. M.G. and A.T.M. wrote the initial draft of the manuscript. All authors reviewed the manuscript. All authors approved the final manuscript. Acknowledgements We would like to thank Kenneth Hayworth for helpful personal communications on this topic. The Icahn School of Medicine at Mount Sinai provided access to library resources. Electron microscopy tissue preparation and imaging were performed at The Microscopy and Advanced Bioimaging CoRE at the Icahn School of Medicine at Mount Sinai. Serial block face electron microscopy was performed at the Multiscale Microscopy Core, a member of the OHSU University Shared Resource Cores RRID:SCR_022652. Funding This work was supported by the Rainwater Charitable Foundation as well as NIH grants P30 AG066514, K01 AG070326, RF1 AG062348, P30 AG066514, RF1 NS095252, U54 NS115266, and RF1 MH128969. The funders had no role in the design of the study or in the collection or interpretation of the data. Conflict of interest Macy Garrood and Andrew McKenzie are employees of Oregon Brain Preservation, a non-profit brain preservation organization. Andrew McKenzie is a director of Apex Neuroscience, a non-profit research organization. Data availability Screenshots from the regions of interest analyzed in the light microscopy data, as well as the TEM, ssTEM, and SBF-SEM datasets, are publicly available on this Zenodo repository: https://zenodo.org/communities/preservationofcellularstructureviaimmersionfixationinbrainbanking. References Adickes, E.D., Folkerth, R.D., Sims, K.L., 1997. Use of perfusion fixation for improved neuropathologic examination. Arch. Pathol. Lab. Med. 121, 1199–1206. https://pubmed.ncbi.nlm.nih.gov/9372749/ Anton-Sanchez, L., Bielza, C., Merchán-Pérez, A., Rodríguez, J.-R., DeFelipe, J., Larrañaga, P., 2014. Three-dimensional distribution of cortical synapses: a replicated point pattern-based analysis. Front. Neuroanat. 8, 85. https://doi.org/10.3389/fnana.2014.00085 Beach, T.G., Tago, H., Nagai, T., Kimura, H., McGeer, P.L., McGeer, E.G., 1987. Perfusion-fixation of the human brain for immunohistochemistry: comparison with immersion-fixation. J. Neurosci. Methods 19, 183–192. https://doi.org/10.1016/s0165-0270(87)80001-8 Bloss, E.B., Puri, R., Yuk, F., Punsoni, M., Hara, Y., Janssen, W.G., McEwen, B.S., Morrison, J.H., 2013. Morphological and molecular changes in aging rat prelimbic prefrontal cortical synapses. Neurobiol. Aging 34, 200–210. https://doi.org/10.1016/j.neurobiolaging.2012.05.014 Boergens, K.M., Berning, M., Bocklisch, T., Bräunlein, D., Drawitsch, F., Frohnhofen, J., Herold, T., Otto, P., Rzepka, N., Werkmeister, T., Werner, D., Wiese, G., Wissler, H., Helmstaedter, M., 2017. webKnossos: efficient online 3D data annotation for connectomics. Nat. Methods 14, 691–694. https://doi.org/10.1038/nmeth.4331 Bolon, B., Garman, R.H., Pardo, I.D., Jensen, K., Sills, R.C., Roulois, A., Radovsky, A., Bradley, A., Andrews-Jones, L., Butt, M., Gumprecht, L., 2013. STP Position Paper: Recommended Practices for Sampling and Processing the Nervous System (Brain, Spinal Cord, Nerve, and Eye) during Nonclinical General Toxicity Studies. Toxicol. Pathol. 41, 1028–1048. https://doi.org/10.1177/0192623312474865 Cano-Astorga, N., DeFelipe, J., Alonso-Nanclares, L., 2021. Three-Dimensional Synaptic Organization of Layer III of the Human Temporal Neocortex. Cereb. Cortex N. Y. N 1991 31, 4742–4764. https://doi.org/10.1093/cercor/bhab120 Cano-Astorga, N., Plaza-Alonso, S., DeFelipe, J., Alonso-Nanclares, L., 2024. Volume electron microscopy analysis of synapses in primary regions of the human cerebral cortex. Cereb. Cortex N. Y. N 1991 34, bhae312. https://doi.org/10.1093/cercor/bhae312 Dadar, M., Sanches, L., Fouqouet, J., Moqadam, R., Alasmar, Z., Miraut, D., Maranzano, J., Mechawar, N., Chakravarty, M.M., Zeighami, Y., 2024. The Douglas Bell Canada Brain Bank Post-mortem Brain Imaging Protocol. https://doi.org/10.1101/2024.02.27.582303 Dawe, R.J., Bennett, D.A., Schneider, J.A., Vasireddi, S.K., Arfanakis, K., 2009. Postmortem MRI of human brain hemispheres: T2 relaxation times during formaldehyde fixation. Magn. Reson. Med. 61, 810–818. https://doi.org/10.1002/mrm.21909 Deerinck, T.J., Bushong, E.A., Thor, A., Ellisman, M.H., 2010. NCMIR methods for 3D EM: a new protocol for preparation of biological specimens for serial block face scanning electron microscopy. Microscopy 1, 6–8.https://dx.doi.org/10.17504/protocols.io.36wgq7je5vk5/v2 Dempster, W.T., 1960. Rates of penetration of fixing fluids. Am. J. Anat. 107, 59–72. https://doi.org/10.1002/aja.1001070105 Du, T., Mestre, H., Kress, B.T., Liu, G., Sweeney, A.M., Samson, A.J., Rasmussen, M.K., Mortensen, K.N., Bork, P.A.R., Peng, W., Olveda, G.E., Bashford, L., Toro, E.R., Tithof, J., Kelley, D.H., Thomas, J.H., Hjorth, P.G., Martens, E.A., Mehta, R.I., Hirase, H., Mori, Y., Nedergaard, M., 2022. Cerebrospinal fluid is a significant fluid source for anoxic cerebral oedema. Brain J. Neurol. 145, 787–797. https://doi.org/10.1093/brain/awab293 Finnie, J.W., Blumbergs, P.C., Manavis, J., 2016. Temporal Sequence of Autolysis in the Cerebellar Cortex of the Mouse. J. Comp. Pathol. 154, 323–328. https://doi.org/10.1016/j.jcpa.2016.03.005 Fish, P.A., 1895. Formalin for the preservation of brains. J. Comp. Neurol. 5, 126–128. https://doi.org/10.1002/cne.910050205 Grinberg, L.T., Amaro, E., Teipel, S., dos Santos, D.D., Pasqualucci, C.A., Leite, R.E.P., Camargo, C.R., Gonçalves, J.A., Sanches, A.G., Santana, M., Ferretti, R.E.L., Jacob-Filho, W., Nitrini, R., Heinsen, H., Brazilian Aging Brain Study Group, 2008. Assessment of factors that confound MRI and neuropathological correlation of human postmortem brain tissue. Cell Tissue Bank. 9, 195–203. https://doi.org/10.1007/s10561-008-9080-5 Hahn, E.E., Alexander, M.R., Grealy, A., Stiller, J., Gardiner, D.M., Holleley, C.E., 2022. Unlocking inaccessible historical genomes preserved in formalin. Mol. Ecol. Resour. 22, 2130–2147. https://doi.org/10.1111/1755-0998.13505 Hayat, M.A., 1981. 2 - Factors affecting the quality of fixation, in: Hayat, M.A. (Ed.), Fixation for Electron Microscopy. Academic Press, pp. 9–63. https://doi.org/10.1016/B978-0-12-333920-1.50006-9 Hayworth, K.J., Xu, C.S., Lu, Z., Knott, G.W., Fetter, R.D., Tapia, J.C., Lichtman, J.W., Hess, H.F., 2015. Ultrastructurally smooth thick partitioning and volume stitching for large-scale connectomics. Nat. Methods 12, 319–322. https://doi.org/10.1038/nmeth.3292 Helander, K.G., 1999. Formaldehyde Binding in Brain and Kidney: A Kinetic Study of Fixation. J. Histotechnol. 22, 317–318. https://doi.org/10.1179/his.1999.22.4.317 Hinton, A., Katti, P., Christensen, T.A., Mungai, M., Shao, J., Zhang, L., Trushin, S., Alghanem, A., Jaspersen, A., Geroux, R.E., Neikirk, K., Biete, M., Lopez, E.G., Shao, B., Vue, Z., Vang, L., Beasley, H.K., Marshall, A.G., Stephens, D., Damo, S., Ponce, J., Bleck, C.K.E., Hicsasmaz, I., Murray, S.A., Edmonds, R.A.C., Dajles, A., Koo, Y.D., Bacevac, S., Salisbury, J.L., Pereira, R.O., Glancy, B., Trushina, E., Abel, E.D., 2023. A Comprehensive Approach to Sample Preparation for Electron Microscopy and the Assessment of Mitochondrial Morphology in Tissue and Cultured Cells. Adv. Biol. 7, e2200202. https://doi.org/10.1002/adbi.202200202 Horsley, V.A.H., 1997. III. Description of the brain of Mr. Charles Babbage, F. R. S. Philos. Trans. R. Soc. Lond. Ser. B Contain. Pap. Biol. Character 200, 117–131. https://doi.org/10.1098/rstb.1909.0003 Karlupia, N., Schalek, R.L., Wu, Y., Meirovitch, Y., Wei, D., Charney, A.W., Kopell, B.H., Lichtman, J.W., 2023. Immersion Fixation and Staining of Multicubic Millimeter Volumes for Electron Microscopy-Based Connectomics of Human Brain Biopsies. Biol. Psychiatry 94, 352–360. https://doi.org/10.1016/j.biopsych.2023.01.025 Kay, K.R., Smith, C., Wright, A.K., Serrano-Pozo, A., Pooler, A.M., Koffie, R., Bastin, M.E., Bak, T.H., Abrahams, S., Kopeikina, K.J., McGuone, D., Frosch, M.P., Gillingwater, T.H., Hyman, B.T., Spires-Jones, T.L., 2013. Studying synapses in human brain with array tomography and electron microscopy. Nat. Protoc. 8, 1366–1380. https://doi.org/10.1038/nprot.2013.078 Kiernan, J., 2009. A system for quantitative evaluation of fixatives for light microscopy using paraffin sections of kidney and brain. Biotech. Histochem. 84, 1–10. https://doi.org/10.1080/10520290802646619 Knudsen, S.K., Mørk, S., Øen, E.O., 2002. A novel method for in situ fixation of whale brains. J. Neurosci. Methods 120, 35–44. https://doi.org/10.1016/s0165-0270(02)00182-6 Krassner, M.M., Kauffman, J., Sowa, A., Cialowicz, K., Walsh, S., Farrell, K., Crary, J.F., McKenzie, A.T., 2023. Postmortem changes in brain cell structure: a review. Free Neuropathol. 4, 4–10. https://doi.org/10.17879/freeneuropathology-2023-4790 Krause, M., Brüne, M., Theiss, C., 2016. Preparation of human formalin-fixed brain slices for electron microscopic investigations. Ann. Anat. 206, 27–33. https://doi.org/10.1016/j.aanat.2016.04.030 Lindblom, R.P.F., Tovedal, T., Norlin, B., Hillered, L., Englund, E., Thelin, S., 2021. Mechanical Reperfusion Following Prolonged Global Cerebral Ischemia Attenuates Brain Injury. J Cardiovasc. Transl. Res. 14, 338–347. https://doi.org/10.1007/s12265-020-10058-9 Liu, S., Amgad, M., More, D., Rathore, M.A., Salgado, R., Cooper, L.A.D., 2024. A panoptic segmentation dataset and deep-learning approach for explainable scoring of tumor-infiltrating lymphocytes. Npj Breast Cancer 10, 1–10. https://doi.org/10.1038/s41523-024-00663-1 Liu, X.-B., Schumann, C.M., 2014. Optimization of electron microscopy for human brains with long-term fixation and fixed-frozen sections. Acta Neuropathol. Commun. 2, 42. https://doi.org/10.1186/2051-5960-2-42 Lossinsky, A.S., Shivers, R.R., 2003. Studies of Cerebral Endothelium by Scanning and High-Voltage Electron Microscopy, in: Nag, S. (Ed.), The Blood-Brain Barrier: Biology and Research Protocols. Humana Press, Totowa, NJ, pp. 67–82. https://doi.org/10.1385/1-59259-419-0:67 McFadden, W.C., Walsh, H., Richter, F., Soudant, C., Bryce, C.H., Hof, P.R., Fowkes, M., Crary, J.F., McKenzie, A.T., 2019. Perfusion fixation in brain banking: a systematic review. Acta Neuropathol. Commun. 7, 146. https://doi.org/10.1186/s40478-019-0799-y McKee, A.C., 1999. Brain banking: basic science methods. Alzheimer Dis. Assoc. Disord. 13 Suppl 1, S39-44.https://pubmed.ncbi.nlm.nih.gov/10369517/ McKenzie, A.T., Nnadi, O., Slagell, K.D., Thorn, E.L., Farrell, K., Crary, J.F., 2024. Fluid preservation in brain banking: a review. Free Neuropathol. 5, 5–10. https://pubmed.ncbi.nlm.nih.gov/28275269/ McKenzie, A.T., Woodoff-Leith, E., Dangoor, D., Cervera, A., Ressler, H., Whitney, K., Dams-O’Connor, K., Wu, Z., Hillman, E.M.C., Seifert, A.C., Crary, J.F., 2022. Ex situ perfusion fixation for brain banking: a technical report. Free Neuropathol. 3, 22–22. https://doi.org/10.17879/freeneuropathology-2022-4368 Monfils, M.-H., Bray, D.F., Driscoll, I., Kleim, J.A., Kolb, B., 2005. A quantitative comparison of synaptic density following perfusion versus immersion fixation in the rat cerebral cortex. Microsc. Res. Tech. 67, 300–304. https://doi.org/10.1002/jemt.20214 Morales, J., Rodríguez, A., Rodríguez, J.-R., Defelipe, J., Merchán-Pérez, A., 2013. Characterization and extraction of the synaptic apposition surface for synaptic geometry analysis. Front. Neuroanat. 7, 20. https://doi.org/10.3389/fnana.2013.00020 Musiał, A., Gryglewski, R.W., Kielczewski, S., Loukas, M., Wajda, J., 2016. Formalin use in anatomical and histological science in the 19th and 20th centuries. Folia Med. Cracov. 56, 31–40.https://doi.org/10.3389/fcell.2021.629503 Nahirney, P.C., Tremblay, M.-E., 2021. Brain Ultrastructure: Putting the Pieces Together. Front. Cell Dev. Biol. 9, 629503. https://doi.org/10.1136/jnnp.41.2.191-c Oost, W., Huitema, A.J., Kats, K., Giepmans, B.N.G., Kooistra, S.M., Eggen, B.J.L., Baron, W., 2023. Pathological ultrastructural alterations of myelinated axons in normal appearing white matter in progressive multiple sclerosis. Acta Neuropathol. Commun. 11, 100. https://doi.org/10.1186/s40478-023-01598-7 Peters, A., Palay, S.L., Webster, H. de F., 1991. The Fine Structure of the Nervous System: Neurons and Their Supporting Cells. Oxford University Press.https://doi.org/10.3389/fcell.2021.629503 Rollenhagen, A., Sätzler, K., Lübke, J.H.R., 2024. Quantitative Analysis of the Synaptic Organization of the Human Temporal Lobe Neocortex, in: Lübke, J.H.R., Rollenhagen, A. (Eds.), New Aspects in Analyzing the Synaptic Organization of the Brain. Springer US, New York, NY, pp. 201–230. https://doi.org/10.1007/978-1-0716-4019-7_12 Santuy, A., Rodríguez, J.-R., DeFelipe, J., Merchán-Pérez, A., 2018. Study of the Size and Shape of Synapses in the Juvenile Rat Somatosensory Cortex with 3D Electron Microscopy. eNeuro 5. https://doi.org/10.1523/ENEURO.0377-17.2017 Schweizer, R., Helms, G., Frahm, J., 2014. Revisiting a historic human brain with magnetic resonance imaging - the first description of a divided central sulcus. Front. Neuroanat. 8, 35. https://doi.org/10.3389/fnana.2014.00035 Scott, I.S., MacDonald, A.W., 2013. An evaluation of overnight fixation to facilitate neuropathological examination in Coroner’s autopsies: our experience of over 200 cases. J. Clin. Pathol. 66, 50–53. https://doi.org/10.1136/jclinpath-2012-200839 Sele, M., Wernitznig, S., Lipovšek, S., Radulović, S., Haybaeck, J., Birkl-Toeglhofer, A.M., Wodlej, C., Kleinegger, F., Sygulla, S., Leoni, M., Ropele, S., Leitinger, G., 2019. Optimization of ultrastructural preservation of human brain for transmission electron microscopy after long post-mortem intervals. Acta Neuropathol. Commun. 7, 144. https://doi.org/10.1186/s40478-019-0794-3 Shapson-Coe, A., Januszewski, M., Berger, D.R., Pope, A., Wu, Y., Blakely, T., Schalek, R.L., Li, P.H., Wang, S., Maitin-Shepard, J., Karlupia, N., Dorkenwald, S., Sjostedt, E., Leavitt, L., Lee, D., Troidl, J., Collman, F., Bailey, L., Fitzmaurice, A., Kar, R., Field, B., Wu, H., Wagner-Carena, J., Aley, D., Lau, J., Lin, Z., Wei, D., Pfister, H., Peleg, A., Jain, V., Lichtman, J.W., 2024. A petavoxel fragment of human cerebral cortex reconstructed at nanoscale resolution. Science 384, eadk4858. https://doi.org/10.1126/science.adk4858 Sharma, M., Grieve, J.H.K., 2006. Rapid fixation of brains: a viable alternative? J. Clin. Pathol. 59, 393–395. https://doi.org/10.1136/jcp.2005.028274 Wahlsten, D., Colbourne, F., Pleus, R., 2003. A robust, efficient and flexible method for staining myelinated axons in blocks of brain tissue. J. Neurosci. Methods 123, 207–214. https://doi.org/10.1016/s0165-0270(02)00359-x Wallace, M.N., Johnston, P.W., Palmer, A.R., 2002. Histochemical identification of cortical areas in the auditory region of the human brain. Exp. Brain Res. 143, 499–508. https://doi.org/10.1007/s00221-002-1014-z Yamamoto, Y., Craggs, L.J.L., Watanabe, A., Booth, T., Attems, J., Low, R.W.C., Oakley, A.E., Kalaria, R.N., 2013. Brain microvascular accumulation and distribution of the NOTCH3 ectodomain and granular osmiophilic material in CADASIL. J. Neuropathol. Exp. Neurol. 72, 416–431. https://doi.org/10.1097/NEN.0b013e31829020b5 Yang, J., Sui, S.-F., Liu, Z., 2022. Brain structure and structural basis of neurodegenerative diseases. Biophys. Rep. 8, 170–181. https://doi.org/10.52601/bpr.2022.220013 Yong-Hing, C.J., Obenaus, A., Stryker, R., Tong, K., Sarty, G.E., 2005. Magnetic resonance imaging and mathematical modeling of progressive formalin fixation of the human brain. Magn. Reson. Med. 54, 324–332. https://doi.org/10.1002/mrm.20578
Copyright: © 2024 The author(s). This is an open access article distributed under the terms of the Creative Commons Attribution 4.0 International License (https://creativecommons.org/licenses/by/4.0/), which permits unrestricted use, distribution, and reproduction in any medium, provided the original author and source are credited, a link to the Creative Commons license is provided, and any changes are indicated. The Creative Commons Public Domain Dedication waiver (https://creativecommons.org/publicdomain/zero/1.0/) applies to the data made available in this article, unless otherwise stated. |