|
|
|||||||||||||||||||||||||||||||||||||||||||||||||||||||||||||||||||||||||||||||||||||||||||||||||||||||||||||||||||||||||||||||||||||||||||||||||||||||||||||||||||||||||||||||||||||||||||||||||||||||||||||||||||||||||||||||||||||||||||||||||||||||||||||||||||||||||||||||||||||||||||||||||||||||||||||||||||||||||||||||||||||||||||||||||||||||||||||||||||||||||||||||||||||||||||||||||||||||||||||||||||||||||||||||||||||||||||||||||||||||||||||||||||||||||||||||||||||||||||||||||||||||||||||||||||||||||||||||||||||||||||||||||||||||||||||||||||||||||||||||||||||||||||||||||||||||||||||||||||||||||||||||||||||||||||||||||||||||||||||||
|
Free Neuropathology 5:7 (2024) |
|||||||||||||||||||||||||||||||||||||||||||||||||||||||||||||||||||||||||||||||||||||||||||||||||||||||||||||||||||||||||||||||||||||||||||||||||||||||||||||||||||||||||||||||||||||||||||||||||||||||||||||||||||||||||||||||||||||||||||||||||||||||||||||||||||||||||||||||||||||||||||||||||||||||||||||||||||||||||||||||||||||||||||||||||||||||||||||||||||||||||||||||||||||||||||||||||||||||||||||||||||||||||||||||||||||||||||||||||||||||||||||||||||||||||||||||||||||||||||||||||||||||||||||||||||||||||||||||||||||||||||||||||||||||||||||||||||||||||||||||||||||||||||||||||||||||||||||||||||||||||||||||||||||||||||||||||||||||||||||||
|
Original Paper |
|||||||||||||||||||||||||||||||||||||||||||||||||||||||||||||||||||||||||||||||||||||||||||||||||||||||||||||||||||||||||||||||||||||||||||||||||||||||||||||||||||||||||||||||||||||||||||||||||||||||||||||||||||||||||||||||||||||||||||||||||||||||||||||||||||||||||||||||||||||||||||||||||||||||||||||||||||||||||||||||||||||||||||||||||||||||||||||||||||||||||||||||||||||||||||||||||||||||||||||||||||||||||||||||||||||||||||||||||||||||||||||||||||||||||||||||||||||||||||||||||||||||||||||||||||||||||||||||||||||||||||||||||||||||||||||||||||||||||||||||||||||||||||||||||||||||||||||||||||||||||||||||||||||||||||||||||||||||||||||||
|
Heterogeneity of DNA methylation profiles and copy number alterations in 10782 adult-type glioblastomas, IDH-wildtype |
|||||||||||||||||||||||||||||||||||||||||||||||||||||||||||||||||||||||||||||||||||||||||||||||||||||||||||||||||||||||||||||||||||||||||||||||||||||||||||||||||||||||||||||||||||||||||||||||||||||||||||||||||||||||||||||||||||||||||||||||||||||||||||||||||||||||||||||||||||||||||||||||||||||||||||||||||||||||||||||||||||||||||||||||||||||||||||||||||||||||||||||||||||||||||||||||||||||||||||||||||||||||||||||||||||||||||||||||||||||||||||||||||||||||||||||||||||||||||||||||||||||||||||||||||||||||||||||||||||||||||||||||||||||||||||||||||||||||||||||||||||||||||||||||||||||||||||||||||||||||||||||||||||||||||||||||||||||||||||||||
|
David E. Reuss1,2, Daniel Schrimpf1,2, Asan Cherkezov1,2, Abigail K. Suwala1,2, Tereza Lausová1,2, Matija Snuderl3, David Capper4, Martin Sill5,6, David T. W. Jones6,7,8, Stefan M. Pfister6,8, Felix Sahm1,2,6, Andreas von Deimling1,2,6 |
|||||||||||||||||||||||||||||||||||||||||||||||||||||||||||||||||||||||||||||||||||||||||||||||||||||||||||||||||||||||||||||||||||||||||||||||||||||||||||||||||||||||||||||||||||||||||||||||||||||||||||||||||||||||||||||||||||||||||||||||||||||||||||||||||||||||||||||||||||||||||||||||||||||||||||||||||||||||||||||||||||||||||||||||||||||||||||||||||||||||||||||||||||||||||||||||||||||||||||||||||||||||||||||||||||||||||||||||||||||||||||||||||||||||||||||||||||||||||||||||||||||||||||||||||||||||||||||||||||||||||||||||||||||||||||||||||||||||||||||||||||||||||||||||||||||||||||||||||||||||||||||||||||||||||||||||||||||||||||||||
|
Corresponding author: |
|||||||||||||||||||||||||||||||||||||||||||||||||||||||||||||||||||||||||||||||||||||||||||||||||||||||||||||||||||||||||||||||||||||||||||||||||||||||||||||||||||||||||||||||||||||||||||||||||||||||||||||||||||||||||||||||||||||||||||||||||||||||||||||||||||||||||||||||||||||||||||||||||||||||||||||||||||||||||||||||||||||||||||||||||||||||||||||||||||||||||||||||||||||||||||||||||||||||||||||||||||||||||||||||||||||||||||||||||||||||||||||||||||||||||||||||||||||||||||||||||||||||||||||||||||||||||||||||||||||||||||||||||||||||||||||||||||||||||||||||||||||||||||||||||||||||||||||||||||||||||||||||||||||||||||||||||||||||||||||||
|
Additional resources and electronic supplementary material: supplementary material |
|||||||||||||||||||||||||||||||||||||||||||||||||||||||||||||||||||||||||||||||||||||||||||||||||||||||||||||||||||||||||||||||||||||||||||||||||||||||||||||||||||||||||||||||||||||||||||||||||||||||||||||||||||||||||||||||||||||||||||||||||||||||||||||||||||||||||||||||||||||||||||||||||||||||||||||||||||||||||||||||||||||||||||||||||||||||||||||||||||||||||||||||||||||||||||||||||||||||||||||||||||||||||||||||||||||||||||||||||||||||||||||||||||||||||||||||||||||||||||||||||||||||||||||||||||||||||||||||||||||||||||||||||||||||||||||||||||||||||||||||||||||||||||||||||||||||||||||||||||||||||||||||||||||||||||||||||||||||||||||||
|
Submitted: 02 February 2024 |
|||||||||||||||||||||||||||||||||||||||||||||||||||||||||||||||||||||||||||||||||||||||||||||||||||||||||||||||||||||||||||||||||||||||||||||||||||||||||||||||||||||||||||||||||||||||||||||||||||||||||||||||||||||||||||||||||||||||||||||||||||||||||||||||||||||||||||||||||||||||||||||||||||||||||||||||||||||||||||||||||||||||||||||||||||||||||||||||||||||||||||||||||||||||||||||||||||||||||||||||||||||||||||||||||||||||||||||||||||||||||||||||||||||||||||||||||||||||||||||||||||||||||||||||||||||||||||||||||||||||||||||||||||||||||||||||||||||||||||||||||||||||||||||||||||||||||||||||||||||||||||||||||||||||||||||||||||||||||||||||
|
Keywords: Glioblastoma, Copy Number Variations, CNV, Methylation, Classification, 7/10 signature, EGFR, CDKN2A/B, Amplification, Homozygous deletion |
|||||||||||||||||||||||||||||||||||||||||||||||||||||||||||||||||||||||||||||||||||||||||||||||||||||||||||||||||||||||||||||||||||||||||||||||||||||||||||||||||||||||||||||||||||||||||||||||||||||||||||||||||||||||||||||||||||||||||||||||||||||||||||||||||||||||||||||||||||||||||||||||||||||||||||||||||||||||||||||||||||||||||||||||||||||||||||||||||||||||||||||||||||||||||||||||||||||||||||||||||||||||||||||||||||||||||||||||||||||||||||||||||||||||||||||||||||||||||||||||||||||||||||||||||||||||||||||||||||||||||||||||||||||||||||||||||||||||||||||||||||||||||||||||||||||||||||||||||||||||||||||||||||||||||||||||||||||||||||||||
|
Abstract
The morphological patterns leading to the diagnosis of glioblastoma may also commonly be observed in several other distinct tumor entities, which can result in a mixed bag of tumors subsumed under this diagnosis. The 2021 WHO Classification of CNS Tumors has separated several of these entities from the diagnosis of glioblastoma, IDH-wildtype. This study determines the DNA methylation classes most likely receiving the diagnosis glioblastoma, IDH wildtype according to the definition by the WHO 2021 Classification and provides comparative copy number analyses. |
|||||||||||||||||||||||||||||||||||||||||||||||||||||||||||||||||||||||||||||||||||||||||||||||||||||||||||||||||||||||||||||||||||||||||||||||||||||||||||||||||||||||||||||||||||||||||||||||||||||||||||||||||||||||||||||||||||||||||||||||||||||||||||||||||||||||||||||||||||||||||||||||||||||||||||||||||||||||||||||||||||||||||||||||||||||||||||||||||||||||||||||||||||||||||||||||||||||||||||||||||||||||||||||||||||||||||||||||||||||||||||||||||||||||||||||||||||||||||||||||||||||||||||||||||||||||||||||||||||||||||||||||||||||||||||||||||||||||||||||||||||||||||||||||||||||||||||||||||||||||||||||||||||||||||||||||||||||||||||||||
|
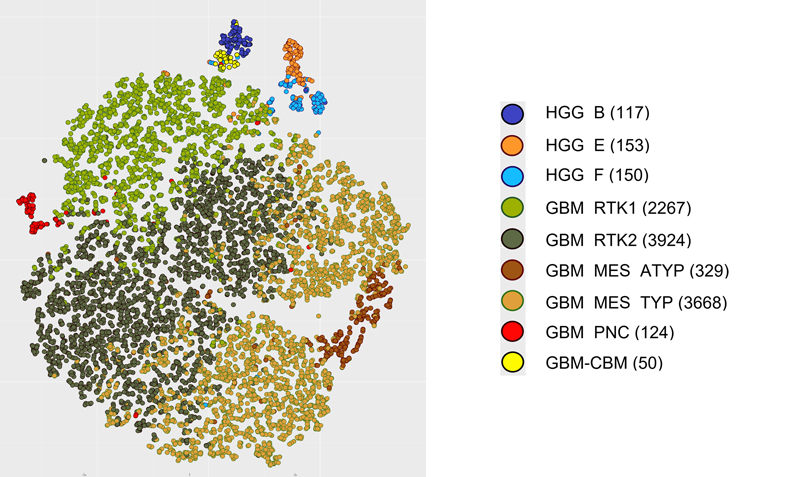
Introduction The term glioblastoma multiforme was introduced by Percival Bailey and Harvey Cushing in 1926. However, the definition of glioblastoma has experienced major change in the last decades accompanying the evolution of the current WHO Classification for CNS Tumors. Initially based purely on histology (1) with gradual inclusion of molecular findings (2), WHO grading of brain tumors has now transformed (3,4) to a classification system heavily relying on molecular parameters (5). In this process the relevance of the IDH mutation status for glioblastomas has been recognized (6) and consequently, IDH-mutant glioblastomas were separated from glioblastoma, IDH-wildtype. Further, H3F3A K27M mutations were recognized within malignant brain stem gliomas (7) and had been categorized as the first pediatric highly aggressive brain tumor group designated diffuse midline glioma, H3 K27-altered. Major overhaul was introduced in the 2021 (5th) edition (5) which radically separated pediatric from adult high-grade gliomas. The distinct tumor types of infant-type hemispheric glioma, diffuse pediatric-type high-grade glioma, H3-wildtype and IDH-wildtype (8), and diffuse hemispheric glioma, H3 G34-altered were added. The latter tumor type, however, also is frequently seen in adult patients and the exclusive sorting with pediatric tumors may be subject to change in the future. Also, high-grade astrocytoma with piloid features was elevated to a separate tumor entity stripping many cerebellar high grade gliomas from the glioblastoma, IDH-wildtype pool. Several approaches to the molecular subclassification of glioblastomas have been taken ranging from initial detection of chromosomal alterations (9), gene expression (10) and CpG methylation (11). Here we focus entirely on CpG methylation by analyzing an unprecedented series of tumors representing WHO adult glioblastoma IDH-wildtype employing data generated by the IlluminaHumanMethylation450 (450k) or MethylationEPIC (850k) array platforms. Materials and Methods Selection of cases Only datasets derived from analysis with Illumina 450K or Illumina EPIC chips were included in this study. The vast majority of the data were collected from uploads to the www.molecularneuropathology.org webpage for prediction by the Heidelberg brain tumor classifier. In a first step we selected 5719 datasets submitted to the webpage with the diagnosis of glioblastoma and a calibrated score ≥0.9 for any methylation class (mc) included in the v12.8 version of the brain tumor classifier. The v12.8 version has been updated for data from the Infinium MethylationEPIC v2.0 platform, however, also allows analyses of data from older chip generations up to 450K without compromising. This approach yielded a list containing 83 different mc (Supplementary table 1). From this list, mc were selected in which the most prevalent diagnosis was glioblastoma. Because WHO in its 2021 edition separated pediatric from adult gliomas, only methylation groups with a majority of patients in the adult age range were included. Further, mc corresponding to distinct WHO tumor types other than glioblastoma IDH-wildtype were excluded; examples of excluded mc are astrocytoma, IDH-mutant and diffuse hemispheric glioma, H3 G34-mutant. This approach resulted in nine mc: glioblastoma, IDH-wildtype, RTK2 subtype (mc GBM_RTK2); glioblastoma, IDH-wildtype, typical mesenchymal type (mc GBM_MES_TYP); glioblastoma, IDH-wildtype, RTK1 subtype (mc GBM_RTK1); glioblastoma, IDH-wildtype, atypical mesenchymal type (mc GBM_MES_ATYP); adult-type diffuse high grade glioma, IDH-wildtype, subtype E (mc HGG_E), adult-type diffuse high grade glioma, IDH-wildtype, subtype B (mc HGG_B); adult-type diffuse high grade glioma, IDH-wildtype, subtype F (mc HGG_F); glioblastoma, IDH-wildtype, with primitive neuronal component (mc GBM_PNC); and high-grade diffuse glioma of the midline/posterior fossa, H3/IDH-wildtype (mc GBM_CBM). In a second step we screened the Heidelberg brain tumor data base for tumors with a prediction for these 9 mc and a calibrated score ≥0.9. Inclusion was based on prediction only and independent from accompanying diagnosis. This procedure yielded the study group including a total of 10782 tumors from independent patients. Generation of tSNE, CNV and summary CNV plots tSNE analyses were performed using the R-Package Rtsne (https://github.com/jkrijthe/Rtsne) employing the 20,000 most variable CpG sites according to standard deviation; 3000 iterations and a perplexity value of 10. Copy number variation (CNV) data were calculated from the output of the Illumina 450K or 850K/EPIC platforms. CNV plots are based on the raw data subjected to analysis by the 'conumee' R package (12) (https://github.com/mwsill/conumee-2). Assessment of copy-number alterations was automated using the results from conumee after additional baseline correction. Amplifications were called if the respective probes exhibited a value higher than 0.52 on a log2 scale. Homozygous deletions were called if the respective probes exhibited a value lower than −0.4 on a log2 scale. Statistics Given the large number of parameters, tests for deviations from normal distributions were not performed. The supplementary files provide all information for executing targeted statistical analyses. Results Methylation classes with frequent glioblastoma diagnoses Applying the inclusion criteria 8 mc were identified with glioblastoma being the predominant accompanying histological diagnosis. One mc, HGG_F, actually fails the inclusion criteria because the most frequent diagnosis was glioma including lower grade tumors. However, the preliminary nomenclature implies close relation to mc HGG_B and mc HGG_E. Therefore, mc HGG_F was not excluded from these analyses and the present series contains 10782 tumors falling into 9 mc. Figure 1 depicts a tSNE analysis of the study set.
Figure 1. tSNE showing the distribution of 9 mc subsumed within the WHO 2021 diagnosis of glioblastoma, IDH-wildtype Diagnoses in 9 methylation classes Pathological diagnoses submitted at time of upload to www.molecularneuropathology.org were categorized. Table 1 depicts 27 categorized diagnoses and the prevalence for each in the 9 mc. No diagnosis was provided at upload to the webpage for 3690 of 10782 tumors. The frequency for tumors submitted without a diagnosis was rather evenly distributed among the 9 mc ranging from 22 % to 37 %. This provided a basis for searching for frequencies of other diagnoses showing major deviations among the 9 mc. The bulk of the tumors (9857 of 10782 cases) belonged to the three mc GBM_MES_TYP, mc GBM_RTK1 and GBM_RTK2 corresponding to the mc GBM_MES mc GBM_RTK1 and GBM_RTK2 defined in the first public version v11b4 of the brain tumor classifier (13). The other 923 tumors split up in 6 mc which were first introduced in version 12.5 of the brain tumor classifier.
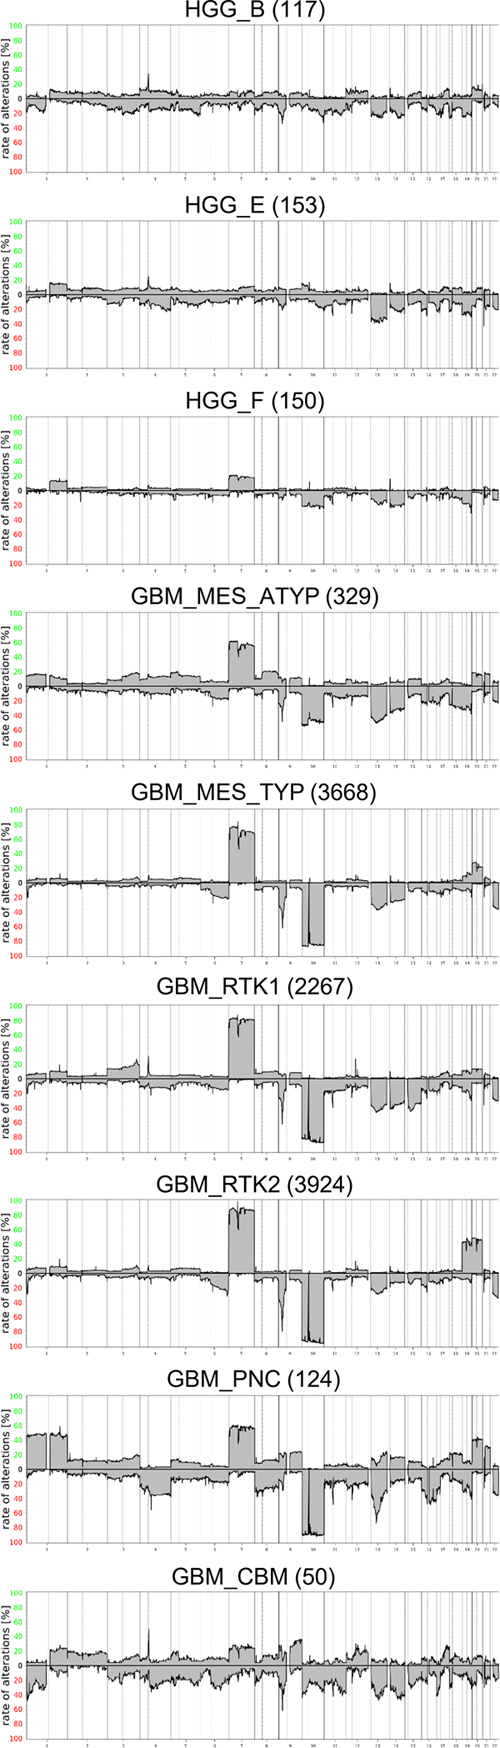
The diagnosis of glioblastoma was most frequently given for tumors belonging to the three, mc GBM_MES_TYP, mc GBM_RTK1 and GBM_RTK2 with incidences of 43 %, 48 % and 45 %. In contrast, only 21 % of tumors in mc GBM_MES_ATYP received the diagnosis glioblastoma. Alternatively, mc GBM_MES_ATYP collected the highest proportions of epithelioid glioblastoma, gliosarcoma, pleomorphic xanthoastrocytoma (PXA), and sarcoma diagnoses. This indicates that the morphology of tumors in this mc is more heterogeneous than that of the three "canonical" mc GBM_MES_TYP, mc GBM_RTK1 and GBM_RTK2. The novel mc GBM_PNC (glioblastoma with primitive neuronal component) (14) and GBM_CBM collected the majority of the medulloblastoma and PNET diagnoses. Overview on copy number variation in 9 methylation classes Summary CNV plots were calculated for all 9 mc providing an overview on frequent gross numerical aberrations (Figure 2). Visual inspection reveals substantial differences. As expected, the 7/10 signature appears evident in the three canonical mc GBM_MES_TYP, mc GBM_RTK1 and GBM_RTK2, as well as in GBM_MES_ATYP and in GBM_PNC. As previously reported, GBM_PNC profiles frequently show a chromosome 1 gain and a less frequent gain of 7, whereas losses of chromosomes 10 and 13q are highly prevalent (14). In addition, loss of chromosome 16 is more common in mc GBM_PNC. A clear increase of likely combined chromosome 19 and chromosome 20 gains is seen in mc GBM_RTK2 and loss of chromosome 15 is most common in mc GBM_RTK1. In the mc GBM_MES_ATYP loss of chromosomes 18 is more common than in other mc.
Figure 2. Summary CNV plots CNV in the 9 methylation classes and prevalence of the 7/10 signature Combined gain of chromosome 7 and loss of chromosome 10, dubbed 7/10 signature, is a very frequent molecular feature of glioblastoma. Summary copy number plots cannot provide precise numbers on the occurrence of the 7/10 signature, because this approach does not allow differentiation between the number of tumors with either only one or the combination of both lesions. Therefore, analyses of the individual prevalence of chromosomal alterations and their combinations have been performed. An overview of regions most differentially affected is given in Table 2. A compilation of alterations in individual cases is provided in Supplementary table 2.
As suggested by visual inspection, gains of chromosome 1 are most prominent in mc GBM_PNC observed in nearly half of the cases. Gains on chromosomes 19 and 20 are most frequent in mc GBM_RTK2 also approaching 50 % in these tumors. The best parameters for defining the 7/10 signature have not yet been established. In this study, a previously published algorithm has been employed (15). Presence of the 7/10 signature was scored if gain of at least 50 % of the short or the long arm of chromosome 7 coincided with loss of at least 50 % of the short or the long arm of chromosome 10. Employing this algorithm revealed clear differences in the frequency of the 7/10 signature in the different mc. The overall prevalence for the 7/10 signature in the present series was 8133 of 10782 cases corresponding to 75 %. However, this high frequency is mainly due to the very frequent occurrence in the three canonical mc. Highest prevalence was observed in mc GBM_RTK2 with 89 % followed by the two other frequent mc GBM_RTK1 (77 %) and GBM_MES_TYP (73 %). Clearly lower frequencies were observed in GBM_PNC (57 %) and GBM_MES_ATYP (38 %) (Table 1). In the mc HGG_B, HGG_E and HGG_F and GBM_CBM the 7/10 signature was not in the foreground, although in mc HGG_F chromosome 7 gains and chromosome 10 losses were seen in approximately 20 % of cases. However, the combination of chromosome 7 gain and chromosome 10 loss in individual cases, which cannot be recognized in sumCNV plots, was only 15 % in the latter. Prevalence of gene amplifications and CDKN2A/B homozygous deletions in 9 mc Various gene amplifications and homozygous deletions on chromosome 9q containing the CDKN2A/B loci are hallmarks of glioblastoma. A detailed analysis of selected candidate genes and regions was performed on all 10782 datasets. Canonical glioblastoma subtypes are known to harbor specific gene amplifications in different frequencies. For example, EGFR amplifications are most prevalent in transcriptomically "classic" glioblastoma roughly equivalent to methylation class GBM_RTK2, whereas PDGFRA amplifications are enriched in transcriptomically "proneural" glioblastoma roughly equivalent to mc GBM_RTK1 tumors (10,16,17). However, reported frequencies in the literature vary and are likely influenced by the composition of study cohorts and applied methods. Here we analyzed the so far largest cohort enabling the most definitive determination of reference values. Amplification of EGFR occurred in 77 % of GBM_RTK2 but only in 20 % of GBM_RTK1 and 27 % of GBM_MES_TYP. The overall frequency in these three mc approximates 40 %. In contrast EGFR amplification was present at low frequencies in the other 6 mc. CDK4 and MDM2 were amplified most frequently in mc GBM_RTK1. Amplification of PDGFRA was pronounced in mc HGG_B, mc GBM_RTK1 and especially in mc GBM_CBM. The mc with the lowest overall frequencies of gene amplifications were mc HGG_F and mc GBM_MES_ATYP. Table 3 summarizes the most frequent gene amplifications. The distribution in individual tumors is provided in Supplementary table 3.
Substantial underrepresentation of chromosomal portions was most frequently observed on the short arm of chromosome 9 in the region containing the CDKN2A/B loci. We called homozygous deletions upon reading values for regions lower than −0.4 on a log2 scale. This cutoff value results in inclusion of borderline cases, however, more stringent criteria can be applied using the data provided in Supplementary table 3. Homozygous deletion in the CDKN2A/B region is most frequent in mc GBM_RTK2 (82 %) followed by GBM_RTK1 (61 %). mc GBM_CBM and mc GBM_MES_ATYP exhibit this alteration in approximately half of the cases. In contrast, homozygous deletion of CDKN2A/B was detected in only up to one in four cases belonging to mc HGG_B and mc GBM_PNC, and only up to one in ten cases in mc HGG_E and mc HGG_F. Other regions are less commonly affected and calling homozygous deletions in these areas should be done conservatively. Table 4 provides according data.
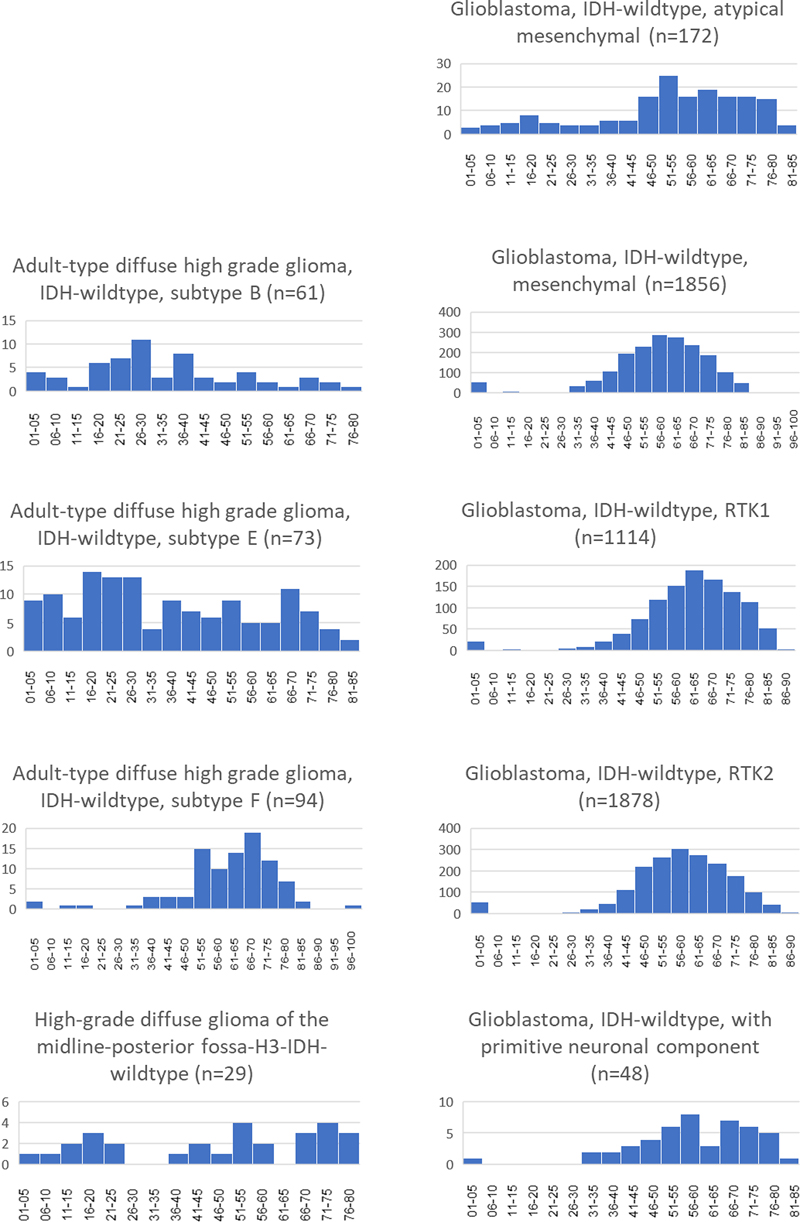
Age distribution Information on age was available for 5153 of 10782 datasets. An age of 0 years was encountered in all mc with entries for subsequent years missing in several mc (Figure 2). This was assumed a result of submitters intention to communicate unknown age of the patient. Therefore, all data referring to age 0 were ignored for age related analyses. The frequent IDH-wildtype glioblastoma mc GBM_MES_TYP, GBM_RTK1 and GBM_RTK2 showed an age distribution matching that of tumors typically occurring in elderly adults. This was also seen for mc GBM_PNC. Upon closer inspection, the median and average ages did show differences, notably the higher median and average ages of patients with mc GBM_RTK1 tumors. Patients with GBM_MES_ATYP and GBM_CBM tumors were markedly younger. Further, GBM_MES_ATYP patients showed also more frequent occurrence in younger patients with an additional, albeit lower, peak in the age group 16 to 20 years old. Age distribution in three mc HGG_B, HGG_E and HGG_F was quite different with HGG_F exhibiting a distribution similar to the frequent GBM mc. Tumors belonging to mc HGG_B were most frequent in middle aged patients while mc HGG_E tumors were observed in all age groups ranging from infants to the elderly. Data for mc GBM_CBM were sparse not allowing to determine ages for peak incidence. However, data on age for 29 patients suggests that patients in all age groups are affected. Figure 3 and Table 5 depicts age distributions in 9 mc. Figure 3
MGMT methylation in 9 mc Methylation of the MGMT promoter is a highly relevant predictor for alkylating chemotherapy (18). Thus, determination of the MGMT methylation status is a routine procedure in neuropathological diagnosis. MGMT methylation status was comparable between the mc GBM_MES_TYP, GBM_RTK1, GBM_RTK2, GBM_PNC and GBM_CBM. Fewer cases with MGMT methylation were encountered in mc GBM_MES_ATYP and mc HGG_E. Patients belonging to mc HGG_F exhibited even lower methylated cases, whereas MGMT methylation in mc HGG_B was barely detected. Table 6 compiles data on the distribution of MGMT methylation in 9 mc.
Comparison of predictions for cases of 9 methylation classes from v12.8 with classifier version 11b4 The brain tumor classifier v12.8 has experienced addition of many new entities. Six of the 9 mc here under investigation are novel and have not been present in classifier version 11b4. We compared v12.8 predictions with v11b4 predictions. Predictions from v11b4 were available for 10778 cases. For the vast majority of cases belonging to one of the six novel mc, no predictions with calibrated scores higher than 0.9 have been generated by version v11b4. For the six novel mc only 97 of 923 predictions reached a score >0.9 and 81/97 were for the methylation family glioblastoma. The predictions for the three canonical mc showed a high overlap between v11b4 and v12.8 output. Of 9859 tumors, 8647 have been predicted with a score ≥0.9 by version 11b4. In these three groups median score for tumors with <0.9 predictions were 0.72 for GBM_MES_TYP, 0.78 for GBM_RTK1 and 0.85 for GBM_RTK2. Data are compiled in Supplementary table 4. Discussion The aim of this study was assessing the homogeneity of tumors currently subsumed under the diagnosis glioblastoma, IDH wildtype according to the WHO classification scheme 2021 (5). Basis for analysis was a set of 10782 methylation datasets matching mc given by the Heidelberg brain tumor classifier version 12.8 which by histology predominantly are classified as glioblastoma within WHO 2021. No clinical data were available apart from a diagnosis for 7092 and age for 5153 of the 10782 patients. This lack of clinical data poses a grave limitation. However, those parameters which could be assessed without clinical data allowed for sound observations based on the large number of samples. Diagnosis for many of the lesions were tentative at time of submission of the methylation data to www.molecularneuropathology.org. The present data clearly show that the WHO 2021 diagnosis of glioblastoma, IDH wildtype encompasses a mixture of tumors belonging to different tumor types. Further, the data provide evidence of high variation of distinct genetic alterations in tumor groups believed to be very closely related. The eight mc with tumors predominantly diagnosed as glioblastoma and one additional mc were identified with very different numbers. While there is a bias for pediatric tumors submitted to methylation analysis, the selected mc mostly occurred in adult patients. Due to similarities between the mc GBM_MES_TYP, mc GBM_RTK1 and mc GBM_RTK2 the brain tumor classifiers assign a family score for glioblastoma. IDH-wildtype. This ensures, that tumors, for example with scores of 0.5, 0.2 and 0.15 for these three mc still would receive a glioblastoma prediction although each individual score would fail the mark of 0.9. While selecting the present series the family score of glioblastomas was not taken in account. This means, that glioblastomas belonging to the mc GBM_MES_TYP, mc GBM_RTK1 and mc GBM_RTK2 are underrepresented in this study. However, it was felt that no additional information would be gained by enlarging the numbers for these three mc. This selection bias, however, implies that the actual occurrence of the other 6 mc may be lower than can be assumed from the relation to the mc GBM_MES_TYP, mc GBM_RTK1 and mc GBM_RTK2 tumor numbers in this study. Nevertheless, tumors belonging to the mc GBM_CBM, mc HGG_B, mc HGG_E, mc HGG_F and mc GBM_PNC are very infrequently encountered in routine practice, thus making their recognition dependent on data collections from large number of institutions. Six of the nine mc under investigation in this study are not represented by a distinct tumor type in WHO 2021 and are in need of future clinical and histopathological characterization. Currently best studied within this group is mc GBM_PNC typically exhibiting gains on chromosome 1 and fewer gene amplifications, lower incidence of the 7/10 signature and fewer homozygous deletions of CDKN2A/B than the majority of glioblastoma IDH wildtype tumors (14). Tumors from the mc HGG_F have recently been characterized as frequently growing with a gliomatosis-like pattern, lacking microvascular proliferation or necrosis, frequent promoter TERT and PIK3R1 mutations and a longer overall survival (19). Tumors from the mc HGG_B and HGG_E shared several features. The patients were distributed across a wider age range and the frequency of chromosomal gains and losses was comparable. This differed in HGG_F; patients in this group were older with very few pediatric and juvenile individuals affected. Interestingly, the dominant diagnoses provided for these patients was glioma and not high grade glioma or glioblastoma, indicating that the majority of submitters had the impression that high malignancy was not obvious in many of the cases, compatible with the reported lack of microvascular proliferation and necrosis in this mc. Copy number alterations varied strongly among the 9 groups. The 7/10 signature predominated in the canonical GBM_MES_TYP, GBM_RTK1 and GBM_RTK2, however, was also present with a lower incidence in GBM_MES_ATYP and GBM_PNC. It was very rare in HGG_B and HGG_E and seen in 12 % and 15 % in GBM_CBM and HGG_F. Several mc exhibited virtually unique features in sumCNV plots. GBM_RTK2 had striking gains of chromosomes 19 and 20, a feature which previously has been associated with long time survival in glioblastoma (20). GBM-PNC showed chromosome 1 gains in nearly half of the cases, which was not a prominent alteration in all other mc (14). The variance in CNV profiles, gene amplifications and deletions also among the three canonical glioblastoma mc remain poorly understood. These may become of future relevance with more personalized targeted therapies emerging, possibly affecting prognoses or prediction for the different mc. In conclusion, tumors from adult patients subsumed under the diagnosis glioblastoma IDH-wildtype in the most recent WHO brain tumor classification can be separated in at least nine groups differing in both methylation and CNV profiles. Clinical characterization of novel subgroups is a pressing issue. It can be expected that glioblastoma IDH-wildtype will be further stratified into several different more narrowly defined brain tumor entities. Acknowledgement Supported by Deutsche Forschungsgemeinschaft, SFB 1389, A05/C06. M. Snuderl, D. Capper, D. Schrimpf, M. Sill, D.T.W. Jones, S. Pfister F. Sahm and A. von Deimling are co-founders and shareholders of Heidelberg Epignostix GmbH. Supplementary tables
References 1. Zülch KJ. Histological typing of tumours of the central nervous system. WHO, editor. Geneva: WHO; 1979. 2. Kleihues P, Cavenee W. Pathology & Genetics Tumors of the Nervous System. Lyon: International Agency for Research on Cancer; 1997. 3. Louis D, Ohgaki H, Wiestler O, Cavenee W, editors. World Health Organization Classification of Tumours of the Central Nervous System. 4 ed. Lyon: IARC; 2007. 4. Louis D, Ohgaki H, Wiestler O, Cavenee WK, editors. World Health Organization Classification of Tumours of the Central Nervous System. Revised 4th ed. Lyon: IARC; 2016. 5. WHO-Classification-of-Tumours-Editorial-Board, editor. Central Nervous System Tumours. 5 ed. Lyon, France2021. 6. Hartmann C, Hentschel B, Wick W, Capper D, Felsberg J, Simon M, et al. Patients with IDH1 wild type anaplastic astrocytomas exhibit worse prognosis than IDH1 mutated glioblastomas and IDH1 mutation status accounts for the unfavorable prognostic effect of higher age: implications for classification of gliomas. Acta Neuropathol. 2010;120(6):707-18. https://doi.org/10.1007/s00401-010-0781-z 7. Schwartzentruber J, Korshunov A, Liu X, Jones D, Pfaff E, Jacob K, et al. Driver mutations in histone H3.3 and chromatin remodelling genes in pediatric glioblastoma. Nature. 2012;482(7384):226-31. https://doi.org/10.1038/nature10833 8. Clarke M, Mackay A, Ismer B, Pickles JC, Tatevossian RG, Newman S, et al. Infant High-Grade Gliomas Comprise Multiple Subgroups Characterized by Novel Targetable Gene Fusions and Favorable Outcomes. Cancer Discov. 2020;10(7):942-63. https://doi.org/10.1158/2159-8290.cd-19-1030 9. von Deimling A, von Ammon K, Schoenfeld D, Wiestler OD, Seizinger BR, Louis DN. Subsets of glioblastoma multiforme defined by molecular genetic analysis. Brain Pathology. 1993;3:19-26. https://doi.org/10.1111/j.1750-3639.1993.tb00721.x 10. Verhaak RG, Hoadley KA, Purdom E, Wang V, Qi Y, Wilkerson MD, et al. Integrated genomic analysis identifies clinically relevant subtypes of glioblastoma characterized by abnormalities in PDGFRA, IDH1, EGFR, and NF1. Cancer Cell. 2010;17(1):98-110. https://doi.org/10.1016/j.ccr.2009.12.020 11. Sturm D, Bender S, Jones DT, Lichter P, Grill J, Becher O, et al. Paediatric and adult glioblastoma: multiform (epi)genomic culprits emerge. Nat Rev Cancer. 2014;14(2):92-107. https://doi.org/10.1038/nrc3655 12. Hovestadt V, Zapatka M. conumee: enhanced copy-number variation analysis using Illumina methylation arrays. v.1.4.2 R package v.0.99.4. 2015. https://bioconductor.org/packages/release/bioc/html/conumee.html 13. Capper D, Engel NW, Stichel D, Lechner M, Gloss S, Schmid S, et al. DNA methylation-based reclassification of olfactory neuroblastoma. Acta Neuropathol. 2018;136(2):255-71. https://doi.org/10.1007/s00401-018-1854-7 14. Suwala AK, Stichel D, Schrimpf D, Maas SLN, Sill M, Dohmen H, et al. Glioblastomas with primitive neuronal component harbor a distinct methylation and copy-number profile with inactivation of TP53, PTEN, and RB1. Acta Neuropathol. 2021;142(1):179-89. https://doi.org/10.1007/s00401-021-02302-6 15. Stichel D, Ebrahimi A, Reuss D, Schrimpf D, Ono T, Shirahata M, et al. Distribution of EGFR amplification, combined chromosome 7 gain and chromosome 10 loss, and TERT promoter mutation in brain tumors and their potential for the reclassification of IDHwt astrocytoma to glioblastoma. Acta Neuropathol. 2018;136(5):793-803. https://doi.org/10.1007/s00401-018-1905-0 16. Sturm D, Witt H, Hovestadt V, Khuong Quang D-A, Jones D, Konermann C, et al. Hotspot Mutations in H3F3A and IDH1 Define Distinct Epigenetic and Biological Subgroups of Glioblastoma. Cancer Cell. 2012;22(4):425-37. https://doi.org/10.1016/j.ccr.2012.08.024 17. Brennan CW, Verhaak RG, McKenna A, Campos B, Noushmehr H, Salama SR, et al. The somatic genomic landscape of glioblastoma. Cell. 2013;155(2):462-77. https://doi.org/10.1016/j.cell.2013.09.034 18. Hegi ME, Diserens AC, Gorlia T, Hamou MF, de Tribolet N, Weller M, et al. MGMT gene silencing and benefit from temozolomide in glioblastoma. N Engl J Med. 2005;352(10):997-1003. https://doi.org/10.1056/nejmoa043331 19. Muench A, Teichmann D, Spille D, Kuzman P, Perez E, May SA, et al. A Novel Type of IDH-wildtype Glioma Characterized by Gliomatosis Cerebri-like Growth Pattern, TERT Promoter Mutation, and Distinct Epigenetic Profile. Am J Surg Pathol. 2023;47(12):1364-75. https://doi.org/10.1097/pas.0000000000002118 20. Geisenberger C, Mock A, Warta R, Rapp C, Schwager C, Korshunov A, et al. Molecular profiling of long-term survivors identifies a subgroup of glioblastoma characterized by chromosome 19/20 co-gain. Acta Neuropathol. 2015;130(3):419-34. https://doi.org/10.1007/s00401-015-1427-y
Copyright: © 2024 The author(s). This is an open access article distributed under the terms of the Creative Commons Attribution 4.0 International License (https://creativecommons.org/licenses/by/4.0/), which permits unrestricted use, distribution, and reproduction in any medium, provided the original author and source are credited, a link to the Creative Commons license is provided, and any changes are indicated. The Creative Commons Public Domain Dedication waiver (https://creativecommons.org/publicdomain/zero/1.0/) applies to the data made available in this article, unless otherwise stated. |