|
|
||||||||||||||||||||||||||||||||||||||||||||||||||||||||||||||||||||||||||||||||||||||||||||||||||||||||||
|
Free Neuropathology 4:15 (2023) |
||||||||||||||||||||||||||||||||||||||||||||||||||||||||||||||||||||||||||||||||||||||||||||||||||||||||||
|
Original Paper |
||||||||||||||||||||||||||||||||||||||||||||||||||||||||||||||||||||||||||||||||||||||||||||||||||||||||||
|
Serum neurofilament light chains in progressive multiple sclerosis patients treated with repeated cycles of high-dose intravenous steroids |
||||||||||||||||||||||||||||||||||||||||||||||||||||||||||||||||||||||||||||||||||||||||||||||||||||||||||
|
Lidia Stork1, Michael Haupts2, Niels Kruse1, Petra Spill-Askeridis3, Adriane Kutllovci1, Martin S. Weber1,4,5, Wolfgang Brück1, Imke Metz1 |
||||||||||||||||||||||||||||||||||||||||||||||||||||||||||||||||||||||||||||||||||||||||||||||||||||||||||
|
||||||||||||||||||||||||||||||||||||||||||||||||||||||||||||||||||||||||||||||||||||||||||||||||||||||||||
|
Corresponding author: |
||||||||||||||||||||||||||||||||||||||||||||||||||||||||||||||||||||||||||||||||||||||||||||||||||||||||||
|
Submitted: 01 August 2023 |
||||||||||||||||||||||||||||||||||||||||||||||||||||||||||||||||||||||||||||||||||||||||||||||||||||||||||
|
Keywords: Progressive multiple sclerosis, Serum neurofilament light chains, High-dose intravenous steroids |
||||||||||||||||||||||||||||||||||||||||||||||||||||||||||||||||||||||||||||||||||||||||||||||||||||||||||
|
Abstract
Background and objectives: In progressive multiple sclerosis (MS) patients, CNS inflammation trapped behind a closed blood brain barrier drives continuous neuroaxonal degeneration, thus leading to deterioration of neurological function. Therapeutics in progressive MS are limited. High-dose intravenous glucocorticosteroids (HDCS) can cross the blood-brain barrier and may reduce inflammation within the CNS. However, the treatment efficacy of HDCS in progressive MS remains controversial. Serum neurofilament light chains (sNfL) are an established biomarker of neuroaxonal degeneration and are used to monitor treatment responses. We aimed to investigate whether repeated cycles of intravenous HDCS reduce the level of sNfL in progressive MS patients. |
||||||||||||||||||||||||||||||||||||||||||||||||||||||||||||||||||||||||||||||||||||||||||||||||||||||||||
|
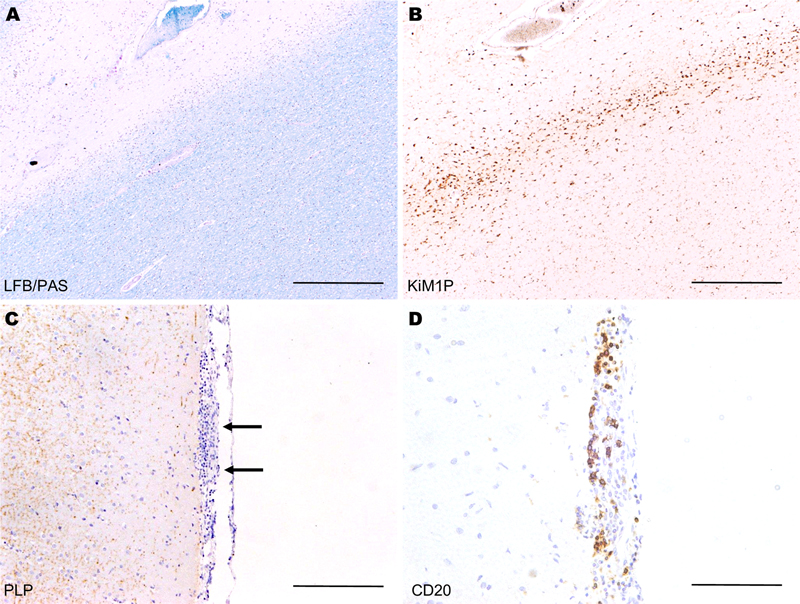
Introduction Neurodegeneration and worsening of clinical disability in progressive multiple sclerosis (MS) occur independently from newly formed, acute inflammatory lesions characterized by MRI contrast enhancement [34]. Pathological findings in progressive MS include so-called slowly expanding lesions, meaning white matter demyelinated lesions with slow expansion at their lesion edge, as well as extensive cortical demyelination and diffuse white matter injury (Figure 1 A-C) [21, 39]. In contrast to relapsing remitting MS, the inflammation in progressive MS becomes trapped or compartmentalized behind a closed blood-brain barrier, and typically no MRI lesion enhancement is observed [11, 34]. A close association between inflammation and neurodegeneration is also evident in progressive MS [20]. A profound microglial activation and meningeal lymphoid structures are associated with tissue injury and demyelination (Figure 1 B-D) [28, 40]. The inflammation causes a widespread neuroaxonal loss not only in white matter lesions, but also in normal-appearing white matter as well as in cortical and deep gray matter [11, 41]. This neuroaxonal loss is thought to be the major cause of progressive, irreversible neurological disability in patients with progressive MS. Therefore, treatment of progressive MS needs to target the compartmentalized CNS inflammation in order to slow down neurodegeneration and disease progression. Figure 1: Histological findings in progressive multiple sclerosis
Typical histological findings in progressive MS include slowly progressing (smouldering) lesions (A, B) as well as meningeal inflammation and cortical demyelination (C, D). Most approved disease-modifying therapies (DMTs) target the peripheral immune system and reduce the number of new acute inflammatory lesions, but they do not significantly slow disability progression in progressive MS. Siponimod and ocrelizumab were shown to reduce confirmed disability progression in progressive MS patients compared to placebo. However, their treatment effects were mostly observed in patients with so-called active disease, meaning in patients with relapses or imaging features of acute inflammatory activity [30]. Interferon-β-1b was also approved in Europe for the treatment of progressive MS with active inflammation [17]. High dose glucocorticosteroids (HDCS) as a treatment option for progressive MS, administered either alone or in combination with other immunomodulatory/immunosuppressive drugs, have been discussed for decades [5, 10, 25, 44, 46]. Steroids cross the blood brain barrier and may thus also target the compartmentalized CNS inflammation in progressive MS patients. A previous study suggested that the oral administration of HDCS is beneficial for the treatment of progressive MS and showed a reduction in neurofilament light chain (NfL) levels in CSF [45]. NfL are structural proteins of axons that are released into the CSF and serum upon neuroaxonal damage. Numerous prior studies showed that serum neurofilament light chains (sNfL) are a plausible biomarker for neuroaxonal degeneration. This biomarker is widely used for monitoring disease activity and treatment responses in MS [32, 52, 55]. In progressive MS, sNfL correlate with brain atrophy and a higher likelihood of disability worsening [31]. Treatment of progressive MS with fingolimod, natalizumab, siponimod, ocrelizumab, and autologous hematopoietic stem cell transplantation reduces sNfL levels [3, 29, 36, 53]. Although sNfL levels are well suited for comparing patient groups, natural fluctuations should be taken into account when evaluating individual patients. Fluctuations in sNfL levels of up to 20% were observed in the majority of a cohort of progressive MS patients [8]. In this study we present a monocentric observational study that evaluates changes in sNfL levels in progressive MS patients with repeated cycles of parenterally given HDCS. Results indicate that long-term treatment with HDCS reduces the neuroaxonal damage in progressive MS patients. Methods Standard Protocol Approval and Patient Consents The ethics committee of the University Medical Center Göttingen approved this study (#1/2/21). Patients gave written informed consent for their study inclusion. The study has been performed in accordance with the ethical standards laid down in the 1964 Declaration of Helsinki and its later amendments. Study cohort The study cohort was recruited in the tertiary neurological clinic Augusta Hospital in Anholt, Germany. Patients were recruited during ongoing clinical routine care from September 2018 to December 2019. Inclusion criteria of the study were: 1) clinically definite MS with a primary or secondary progressive disease course [54], 2) absence of relapse activity at least for 3 months prior to baseline blood sampling and 3) long-term HDCS therapy. Initially, 27 patients were included in this longitudinal study. However, two patients had to be excluded due to a marked increase in sNfL unrelated to MS disease activity, namely due to a traumatic brain injury in one patient and an intrathecal pump implantation in the other. All patients showed no signs of clinical activity and were thus classified as having inactive progressive MS. Clinical assessment Clinical information was obtained by the treating physician via medical record review as well as personal interview and examination. Baseline was defined as time point of the first blood sampling of the first course of HDCS within the frame of the present study. Twenty-one out of our 25 included study patients had previous cycles of HDCS before baseline blood sampling was done, with a median treatment duration of 26 weeks (range 8-120 weeks). The median daily dose of previous HDCS cycles was 1500 mg (range 300-2250 mg). According to the individual clinical situation and patient preferences, the treating physician determined the treatment regimen – the dosage of steroids, duration of cycles and interval between cycles. Patients also received symptomatic treatments including physiotherapy. The clinical course was determined according to published criteria [54]. The Expanded Disability Status Scale (EDSS) score was assessed at two time points: at baseline and before the next HDCS cycle. Relapse activity during the study period as well as the therapy with DMTs were also registered. Due to absence of clinical disease activity, MRIs were not indicated and not available for the study. In addition, comorbidities, the presence of fatigue symptoms as well as a clinical history of smoking and prior infections were noted. Patients with diabetes, coronary heart disease and stroke in their clinical history were grouped as having cardiovascular risk factors. The presence of cognitive deficits and psychiatric symptoms were also recorded. Blood sampling Blood sampling at baseline and within the next 3 weeks (median 1.9, range 0.9 to 2.6 weeks) after baseline HDCS cycle was done for all patients. Blood samples taken directly before the next HDCS cycle (median 26, range 13 - 51.3 weeks) were available for analysis in 24 patients. For a subset of patients, further blood samplings were performed at later time points to assess the change in sNfL levels over time (median 4 samples per patient), with a median time to last follow-up of 28 weeks (range 2-55 weeks). Blood was also taken from 22 healthy age-matched controls and sNfL levels measured to obtain a range for normal values. sNfL measurement with SiMoA technology Serum samples were stored at −80 °C until analysis. Quantification of NfL was done using the SiMoA NF-light Advantage Kit (Quanterix, Bellerica, MA, USA; Cat. No. 103186), as described in detail previously [14]. Assays were performed on a SiMoA HD-1 Analyzer (Quanterix) according to a Quanterix-developed protocol. After completion of the assay, data were analyzed using Quanterix software. Statistical analyses Demographics and clinical characteristics were described by summary statistics appropriate for their scales. Differences between two groups in clinical characteristics and sNfL levels were tested using the Mann–Whitney U test. To compare sNfL levels in repeated blood samples, the Wilcoxon test was used. Spearman correlation was performed to address the question of potential associations between clinical parameters and sNfL levels. To adjust for relevant covariates, the association of sNfL with the time interval that passed from baseline was analyzed using logistic regression models. For multiple linear regression analyses, a logarithmic transformation of sNfL levels was carried out. Statistical analyses were done with GraphPad Prism 6 and SSPS Statistics 28 for Windows. P-values smaller than or equal to 0.05 were regarded as statistically significant. Data Availability The first and the last authors take full responsibility for the data analyses, interpretation, and conduction of the research. They have full access to all of the data and the right to publish these data apart from any sponsorship. Results Patient baseline characteristics A total of 103 blood samples taken from 25 patients were included in our analyses. The patients’ demographic and clinical data at baseline are shown in Table 1. Clinical relapses were not observed for 3 months prior to baseline blood sampling (see inclusion criteria). No relapses occurred during the duration of the study. Five patients were treated with disease-modifying therapies (n=1 interferon-ß-1a; n=2 dimethyl fumarate and n=2 glatiramer acetate). Despite no signs of clinical activity, treatment with DMTs was continued due to patients’ personal preferences and the absence of clear recommendations for therapy withdrawal. Table 1: Demographic and clinical characteristics of the study cohort
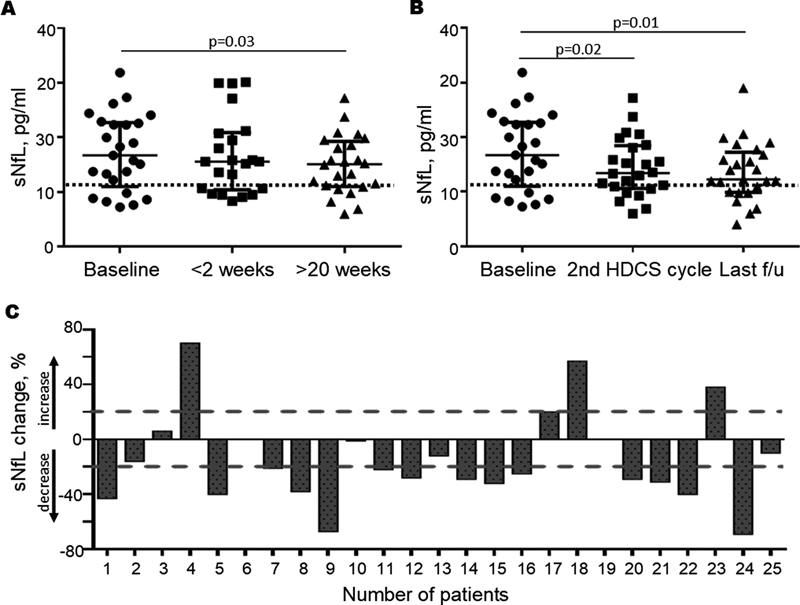
sNfL levels decrease after HDCS therapy sNfL baseline levels were significantly higher in progressive MS patients compared to age-matched healthy controls (median 16.7 pg/ml vs 11.5 pg/ml, p=0.002). Within the first two weeks after baseline HDCS therapy, the median sNfL level was not significantly reduced (median 15.6 pg/ml, p=0.7). However, ≥20 weeks after baseline HDCS therapy the majority of patients (72%, 16/23) showed reduced sNfL levels compared to baseline (median 13.3 pg/ml, p=0.03) (Figure 2A). The median sNfL level was still higher compared to the healthy control cohort, but these differences no longer reached statistical significance. Pairwise comparison of sNfL levels at baseline, subsequent HDCS cycle (2nd cycle during the study) as well as at last follow-up revealed that even more patients (76%, 19/25) had reduced sNfL levels. sNfL levels showed a median reduction of 22% at last follow-up compared to baseline sNfL values (p=0.01) (Figure 2B). This effect was also observed when excluding the 5 patients treated with DMTs (p=0.001; data not shown), indicating that the sNfL reduction is not due to DMT treatment. Although in individual patients a 20% reduction of sNfL levels may be regarded as natural fluctuation [8], on a group level this reduction seems relevant. Individual changes in sNfL levels are shown in Figure 2C. The percentage change of sNfL levels comparing values from baseline and last follow-up for all patients included in the study are given. Fourteen patients (56%) had a reduction in sNfL levels >20% (Figure 2C), with some patients showing a decrease of sNfL levels up to 50% from baseline. In three patients, sNfL levels increased >20%. Clinical history could not reveal any reason for these increases. Figure 2: Reduction of sNfL levels in progressive MS patients treated with HDCS
A: sNfL levels at baseline, within 2 weeks after baseline HDCS cycle and ≥ 20 weeks after baseline HDCS cycle are presented. The median sNfL levels in pg/ml and the interquartile range are shown. The dashed line indicates the median sNfL level of the age-matched healthy control cohort. Significantly lower levels of sNfL were observed ≥ 20 weeks after baseline HDCS treatment (p=0.03; Wilcoxon test), but not at earlier time points (<2 weeks, p=0.7). In accordance with these findings, correlation and logistic regression model analyses showed a negative correlation between sNfL levels and the time that passed after baseline HDCS therapy (r=-0.2, p=0.03; median time interval from baseline 24 weeks, range 0.9-55.0 weeks) (Table 2). Table 2: Correlation of sNfL levels with clinical parameters
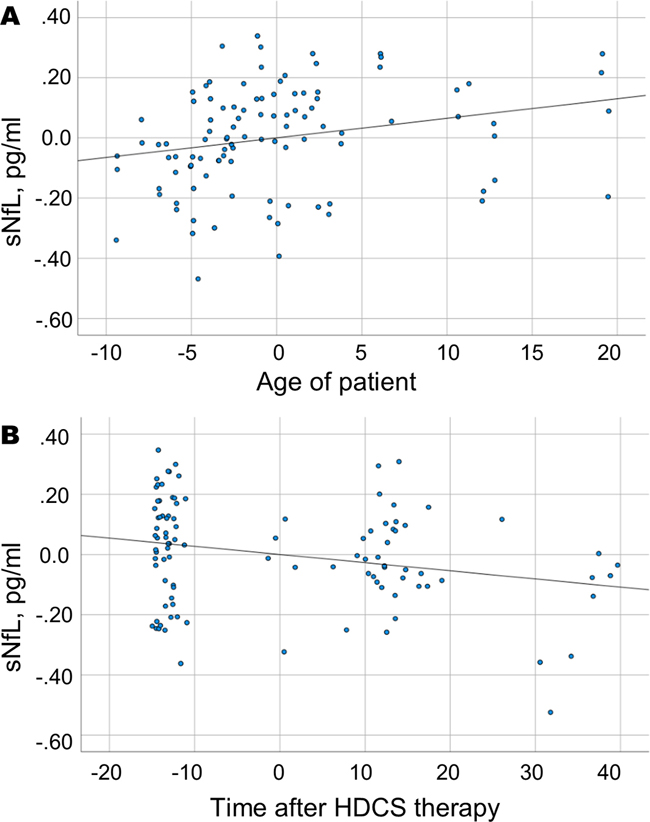
Stable EDSS after HDCS therapy The EDSS score remained stable during a median follow-up time of 26 weeks (range 13-51 weeks) after baseline HDCS therapy (median EDSS 6.5 at baseline and before second HDCS cycle). Confounding factors for sNfL levels As described in previous studies, sNfL levels showed a positive correlation with patient age (r=0.3, p=0.003) (Figure 3A). The gender had no influence on sNfL levels. Other factors such as relapse activity and disease-modifying drugs are also known to influence sNfL levels, but relapse activity was not observed in our cohort of progressive MS patients. The following clinical parameters were analyzed and did not significantly influence sNfL levels: Treatment with DMTs, disability level measured by EDSS, disease course and disease duration, presence of fatigue symptoms, cognitive deficits, psychiatric symptoms, past or present regular nicotine use and cardiovascular risk factors. No association was found between the dose of HDCS that patients received and sNfL levels (Table 2). We performed a multiple regression analysis including the age of patients, treatment with DMTs and the time after baseline HDCS therapy to analyze the influence on sNfL levels. The negative correlation of sNfL levels with the time after baseline HDCS therapy was confirmed (adjusted R2= 10%, p=0.01), verifying a reduction in sNfL levels after HDCS therapy (Figure 3B). DMTs showed no correlation with sNfL and did not influence the level of sNfL in the multiple regression model. However, this analysis was limited due to a small number of patients treated with DMTs (n=5). The model is summarized in Table 3. Figure 3: Partial regression plots of variables that contribute to sNfL levels
The dependent variable is the sNfL level. Independent variables are the age of patients at the time of blood sampling (A) and the time that passed after the baseline HDCS therapy (B). Due to calculations with multiple variables, the scaling of axes differs from normal units and does not seem plausible. sNfL levels correlate positively with the age of patients (A, p=0.003) and shows a negative correlation with the time that passed after the baseline HDCS therapy (B, p=0.03), indicating a reduction in sNfL levels due to HDCS treatment. Table 3: Model to explain sNfL levels in patients after HDCS therapy
sNfL levels were defined as dependent variable. Variables which possibly effect sNfL levels were included in the model. The unstandardized coefficient, the standardized coefficient, the significance, and the confidence interval are shown. This model has been corrected for R2=10%. Discussion We aimed to evaluate the efficacy of long-term treatment with HDCS in patients with progressive MS and used sNfL as an established biomarker for disease activity and treatment response. In our cohort of 25 patients recruited from ongoing clinical routine care, we found that long-term repeated HDCS therapy for patients with progressive MS reduced sNfL levels by 22% after 20 weeks. We observed a reduction of sNfL levels in the majority of patients, so that these changes are most likely due to the steroid therapy and not to normal fluctuations as described by Bridel et al. [8]. This implies that HDCS treatment may reduce ongoing diseaseactivity and neuroaxonal damage in a subgroup of progressive MS patients, which is the main cause of accumulation of clinical disability. In support of this, the EDSS score did not increase during the treatment period. HDCS are effective not only in relapsing-remitting MS but also in progressive MS HDCS are the first-line treatment for MS relapses [6, 35, 44]. This treatment typically provides a rapid clinical benefit, decreasing the severity of clinical symptoms and duration of the attack [18]. Intravenous HDCS treatment of relapses was also associated with a lower risk of contrast-enhancing lesions to turn into black holes, indicating a reduction in destructive lesions [13]. Here, we have shown that repeated HDCS cycles reduce sNfL levels in a subgroup of patients with progressive MS without signs of active inflammation. Early publications support our findings and describe an improvement in the EDSS score as well as a functional benefit from repeated HDCS cycles in progressive MS [5, 10, 25, 44]. Even oral monthly administration of HDCS showed a benefit in progressive MS: The EDSS, MS functional composite test and T2 lesion volume showed a significant improvement after oral HDCS therapy [45]. However, a reduction in CSF biomarkers of inflammation and neurodegeneration including NfL was not observed [45]. In our study, we assessed the treatment effect with the serum biomarker NfL and observed a reduction in the majority of patients (76%) after repeated intravenous cycles of HDCS. Importantly, all of our patients except for one had received HDCS treatments before baseline blood sampling, so that a reduction of sNfL might already have occurred before baseline blood sampling. Thus, the effect of HDCS therapy on sNfL levels might even be stronger than described here. Functional improvement of neurological systems and MRI parameters were not addressed in our study. sNfL levels for HDCS therapy monitoring and long-term treatment effects sNfL levels serve as a highly sensitive marker for neuroaxonal injury in different conditions such as Alzheimer, Parkinson’s, traumatic brain injury or amyotrophic lateral sclerosis [1, 22, 27, 48]. Their concentration increases with age by an average of 2.2% per year in healthy controls [15]. An age-dependent increase in sNfL levels could also be confirmed in our study. Increased sNfL levels reflect recent or ongoing neuroaxonal damage related to ongoing inflammatory activity in late-stage MS [7, 14]. A reduction in sNfL levels indicates less neuroaxonal loss and thus beneficial treatment effects. In progressive MS patients, a reduction in sNfL was observed after treatment with DMTs as well as after autologous hematopoietic stem cell transplantation [3, 29, 33, 36, 53]. sNfL levels typically decrease within 3-6 months after initiation of anti-inflammatory therapies in relapsing-remitting MS [32]. Similar sNfL dynamics were found in our study. A significant reduction in sNfL levels was evident for the first time ≥20 weeks after baseline HDCS treatment, but not at earlier time points, and showed a positive correlation with the time that passed after HDCS treatment. Long-term immunomodulatory effects of HDCS have already been described in previous studies. For example, treatment of the first optic neuritis episode with intravenous HDCS was found to reduce the development of clinical MS within two years [4]. Brain atrophy and the development of T1 black holes in MS patients were reduced with prolonged treatment with intravenous HDCS [56]. A positive effect on the sustained progression of disability after HDCS treatment in progressive MS patients was also observed [25]. Mode of action of HDCS in progressive MS Corticosteroids are used in MS treatment due to their anti-inflammatory effect by inhibiting lymphocyte proliferation and the secretion of pro-inflammatory cytokines, mediated through specific corticoid receptors. However, the immediate and long-term mechanisms of steroid actions are complex and involve both non-genomic and genomic pathways [24]. Interaction of steroids with the cellular membrane and membrane receptors is responsible for the rapid non-genomic mechanism of action, whereas binding of specific cytosolic receptors mediates delayed genomic effects [9, 24]. In progressive MS, the degree of inflammation declines with age and disease duration, but still drives neuroaxonal loss and thus the accrual of disability [20]. So-called smouldering lesions with slowly progressing demyelination and axonal damage at the edge of white matter lesions are a hallmark of progressive MS. These lesions are driven by pro-inflammatory microglial cells as well as by astrocytes with a characteristic and partially pro-inflammatory signature [2, 28]. Next to white matter pathology, lymphoid structures in meninges orchestrate inflammation, demyelination, and neurodegeneration in underlying cortical tissue [40]. Steroids can restore the blood brain-barrier (BBB) and reduce the contrast enhancement of MS lesions. They downregulate the expression of adhesion molecules reducing the extravasation of immune cells into the CNS and improve the integrity of the tight junctions between endothelial cells [16, 23, 47]. However, this effect is short-term, as new contrast enhancing lesions can already be observed 4 weeks after treatment [19, 43]. In our cohort of inactive, progressive MS patients, we found no indication of a BBB impairment, and treatment effects were evident 20 weeks after HDCS treatment. We thus assume that the reduced sNfL levels cannot be explained by steroid effects on the BBB, but indeed indicate a reduction in CNS axonal damage. HDCS treatment reduces the level of the pro-inflammatory cytokines IFN-γ, TNF-α and IL-12, and the effect on TNF-α may last up to several months after the therapy [12, 50]. The anti-inflammatory cytokine IL-10 is also upregulated [26]. Steroid treatment induces apoptosis of T and B cells [37, 49] and shifts the population of CD4+ T lymphocytes to the memory subpopulation [42]. Chronic activation of microglial cells and astrocytes may also be influenced by HDCS: In an animal model of spinal cord injury, steroids could inhibit microglial activation and support the normal function of astrocytes [57]. HDCS treatment also inhibits proliferation of microglia/macrophages and reduces the production of nitric oxide, which is a main effector molecule of these cells [38, 51]. In conclusion, HDCS treatment may reduce inflammatory processes that characterize progressive MS pathology. Limitations of the study Although the present study is limited due to the small patient number, we were able to show a reduction in sNfL levels with long-term HDCS treatment. The observational design of the study implies that patients were not randomized to treatment, and a non-treated control cohort could not be studied. The HDCS therapy was also not standardized, and dosage of steroids ranged from 300-2250 mg per day, depending on the individual clinical situation and patient preferences. However, statistical analyses did not show any steroid dosage effect. Patients included in the study did not experience any relapse activity 3 months prior to the study. We can thus assume that the observed reduction in sNfL was indeed associated with HDCS therapy and was not a consequence of a typical sNfL reduction observed within the months after a relapse had occurred. EDSS score and clinical disease activity were outcome parameters in the study. Due to the absence of clinical symptoms, MRIs were not indicated for routine hospital evaluation and thus not available for analysis. Hence, “silent” MRI activity cannot be completely excluded. Although we did not document steroid side effects in a standardized manner, no severe side effects were observed during the observational period. Conclusion In conclusion, we have shown that treatment with repeated cycles of HDCS reduces the level of sNfL and thus suggests a reduction of ongoing neuroaxonal damage in a subgroup of patients with progressive MS. Although larger studies are needed to confirm these findings, long-term treatment with HDCS should be considered for the treatment of progressive MS patients. References 1. Aamodt WW, Waligorska T, Shen J, Tropea TF, Siderowf A, Weintraub D, Grossman M, Irwin D, Wolk DA, Xie SX et al (2021) Neurofilament Light Chain as a Biomarker for Cognitive Decline in Parkinson Disease. Movement disorders : official journal of the Movement Disorder Society 36: 2945-2950. https://doi.org/10.1002/mds.28779 2. Absinta M, Maric D, Gharagozloo M, Garton T, Smith MD, Jin J, Fitzgerald KC, Song A, Liu P, Lin JP et al (2021) A lymphocyte-microglia-astrocyte axis in chronic active multiple sclerosis. Nature 597: 709-714. https://doi.org/10.1038/s41586-021-03892-7 3. Bar-Or A, Thanei G, Harp C, Cross A, Hauser S, Kuhle J, Leppert D, Oksenberg J, Model F, Fiore DJEOL (2019) Blood neurofilament light levels are lowered to a healthy donor range in patients with RMS and PPMS following ocrelizumab treatment. Multiple sclerosis journal 25: 52. https://doi.org/10.1177/1352458519868070 4. Beck RW, Cleary PA, Trobe JD, Kaufman DI, Kupersmith MJ, Paty DW, Brown CH (1993) The effect of corticosteroids for acute optic neuritis on the subsequent development of multiple sclerosis. The Optic Neuritis Study Group. N Engl J Med 329: 1764-1769. https://doi.org/10.1056/nejm199312093292403 5. Bergamaschi R, Versino M, Raiola E, Citterio A, Cosi V (1993) High-dose methylprednisolone infusions in relapsing and in chronic progressive multiple sclerosis patients. One year follow-up. Acta neurologica 15: 33-43 6. Berkovich RR (2016) Acute Multiple Sclerosis Relapse. Continuum (Minneapolis, Minn) 22: 799-814. https://doi.org/10.1212/con.0000000000000330 7. Bosch van den A, Fransen N, Mason M, Rozemuller AJ, Teunissen C, Smolders J, Huitinga I (2022) Neurofilament Light Chain Levels in Multiple Sclerosis Correlate With Lesions Containing Foamy Macrophages and With Acute Axonal Damage. Neurol-Neuroimmunol Neuroinflammation 9. https://doi.org/10.1212/nxi.0000000000001154 8. Bridel C, Verberk IMW, Heijst JJA, Killestein J, Teunissen CE (2021) Variations in consecutive serum neurofilament light levels in healthy controls and multiple sclerosis patients. Mult Scler Relat Disord 47: 102666. https://doi.org/10.1016/j.msard.2020.102666 9. Buttgereit F, Wehling M, Burmester GR (1998) A new hypothesis of modular glucocorticoid actions: steroid treatment of rheumatic diseases revisited. Arthritis Rheum 41: 761-767. https://doi.org/10.1002/1529-0131(199805)41:5<761::AID-ART2>3.0.CO;2-M 10. Cazzato G, Mesiano T, Antonello R, Monti F, Carraro N, Torre P, Bosco A, Cargnelutti D (1995) Double-blind, placebo-controlled, randomized, crossover trial of high-dose methylprednisolone in patients with chronic progressive form of multiple sclerosis. Eur Neurol 35: 193-198. https://doi.org/10.1159/000117127 11. Cree BAC, Arnold DL, Chataway J, Chitnis T, Fox RJ, Pozo Ramajo A, Murphy N, Lassmann H (2021) Secondary Progressive Multiple Sclerosis: New Insights. Neurology 97: 378-388. https://doi.org/10.1212/wnl.0000000000012323 12. Crockard AD, Treacy MT, Droogan AG, McNeill TA, Hawkins SA (1995) Transient immunomodulation by intravenous methylprednisolone treatment of multiple sclerosis. Mult Scler 1: 20-24. https://doi.org/10.1177/135245859500100104 13. Di Gregorio M, Gaetani L, Eusebi P, Floridi P, Picchioni A, Rosi G, Mancini A, Floridi C, Baschieri F, Gentili L et al (2018) Treatment of multiple sclerosis relapses with high-dose methylprednisolone reduces the evolution of contrast-enhancing lesions into persistent black holes. Journal of Neurology 265: 522-529. https://doi.org/10.1007/s00415-017-8726-2 14. Dietmann AS, Kruse N, Stork L, Gloth M, Brück W, Metz I (2023) Neurofilament light chains in serum as biomarkers of axonal damage in early MS lesions: a histological-serological correlative study. J Neurol 270: 1416-1429. https://doi.org/10.1007/s00415-022-11468-2 15. Disanto G, Barro C, Benkert P, Naegelin Y, Schadelin S, Giardiello A, Zecca C, Blennow K, Zetterberg H, Leppert D et al (2017) Serum Neurofilament Light: A Biomarker of Neuronal Damage in Multiple Sclerosis. Annals of Neurology 81: 857-870. https://doi.org/10.1002/ana.24954 16. Dufour A, Corsini E, Gelati M, Ciusani E, Zaffaroni M, Giombini S, Massa G, Salmaggi A (1998) Modulation of ICAM-1, VCAM-1 and HLA-DR by cytokines and steroids on HUVECs and human brain endothelial cells. Journal of the neurological sciences 157: 117-121. https://doi.org/10.1016/s0022-510x(98)00059-8 17. European Medicine Agency. https://www.emaeuropaeu/en/medicines/human/EPAR/betaferon Update 2019 18. Filippini G, Brusaferri F, Sibley WA, Citterio A, Ciucci G, Midgard R, Candelise L (2000) Corticosteroids or ACTH for acute exacerbations in multiple sclerosis. Cochrane Database Syst Rev: Cd001331. https://doi.org/10.1002/14651858.Cd001331 19. Frequin ST, Barkhof F, Lamers KJ, Hommes OR (1992) The effects of high-dose methylprednisolone on gadolinium-enhanced magnetic resonance imaging and cerebrospinal fluid measurements in multiple sclerosis. J Neuroimmunol 40: 265-272. https://doi.org/10.1016/0165-5728(92)90142-8 20. Frischer JM, Bramow S, Dal-Bianco A, Lucchinetti CF, Rauschka H, Schmidbauer M, Laursen H, Sorensen PS, Lassmann H (2009) The relation between inflammation and neurodegeneration in multiple sclerosis brains. Brain 132: 1175-1189. https://doi.org/10.1093/brain/awp070 21. Frischer JM, Weigand SD, Guo Y, Kale N, Parisi JE, Pirko I, Mandrekar J, Bramow S, Metz I, Bruck W et al (2015) Clinical and pathological insights into the dynamic nature of the white matter multiple sclerosis plaque. Annals of Neurology 78: 710-721. https://doi.org/10.1002/ana.24497 22. Gaetani L, Blennow K, Calabresi P, Di Filippo M, Parnetti L, Zetterberg H (2019) Neurofilament light chain as a biomarker in neurological disorders. J Neurol Neurosurg Psychiatry 90: 870-881. https://doi.org/10.1136/jnnp-2018-320106 23. Gelati M, Corsini E, Dufour A, Massa G, Giombini S, Solero CL, Salmaggi A (2000) High-dose methylprednisolone reduces cytokine-induced adhesion molecules on human brain endothelium. The Canadian journal of neurological sciences Le journal canadien des sciences neurologiques 27: 241-244. https://doi.org/10.1017/s0317167100000883 24. Gold R, Buttgereit F, Toyka KV (2001) Mechanism of action of glucocorticosteroid hormones: possible implications for therapy of neuroimmunological disorders. J Neuroimmunol 117: 1-8. https://doi.org/10.1016/s0165-5728(01)00330-7 25. Goodkin DE, Kinkel RP, Weinstock-Guttman B, Medendorp SV, Secic M, Gogol D, Perryman JE, Uccelli MM, Neilley L (1998) A phase II study of IV methylprednisolone in secondary-progressive multiple sclerosis. Neurology 51: 239-245. https://doi.org/10.1212/wnl.51.1.239 26. Hodge S, Hodge G, Flower R, Han P (1999) Methyl-prednisolone up-regulates monocyte interleukin-10 production in stimulated whole blood. Scandinavian journal of immunology 49: 548-553. https://doi.org/10.1046/j.1365-3083.1999.00538.x 27. Illán-Gala I, Lleo A, Karydas A, Staffaroni AM, Zetterberg H, Sivasankaran R, Grinberg LT, Spina S, Kramer JH, Ramos EM et al (2021) Plasma Tau and Neurofilament Light in Frontotemporal Lobar Degeneration and Alzheimer Disease. Neurology 96: e671-e683. https://doi.org/10.1212/wnl.0000000000011226 28. Jäckle K, Zeis T, Schaeren-Wiemers N, Junker A, van der Meer F, Kramann N, Stadelmann C, Brück W (2020) Molecular signature of slowly expanding lesions in progressive multiple sclerosis. Brain 143: 2073-2088. https://doi.org/10.1093/brain/awaa158 29. Kapoor R, Sellebjerg F, Hartung H-P, Arnold D, Freedman MS, Jeffery D, Miller A, Edwards KR, Singh CM, Chang I (2019) Natalizumab reduces serum concentrations of neurofilament light chain in secondary progressive multiple sclerosis patients from the phase 3 ASCEND study (S12. 008). AAN Enterprises, City 30. Kappos L, Bar-Or A, Cree BAC, Fox RJ, Giovannoni G, Gold R, Vermersch P, Arnold DL, Arnould S, Scherz T et al (2018) Siponimod versus placebo in secondary progressive multiple sclerosis (EXPAND): a double-blind, randomised, phase 3 study. Lancet 391: 1263-1273. https://doi.org/10.1016/s0140-6736(18)30475-6 31. Kuhle J, Kropshofer H, Barro C, Meinert R, Häring DA, Leppert D, Tomic D, Dahlke F, Kappos L (2018) Siponimod Reduces Neurofilament Light Chain Blood Levels in Secondary Progressive Multiple Sclerosis Patients (S8.006). 90: S8.006 32. Kuhle J, Kropshofer H, Haering DA, Kundu U, Meinert R, Barro C, Dahlke F, Tomic D, Leppert D, Kappos L (2019) Blood neurofilament light chain as a biomarker of MS disease activity and treatment response. Neurology 92: E1007-E1015. https://doi.org/10.1212/wnl.0000000000007032 33. Kuhle J, Kropshofer H, Haring D, Barro C, Dahlke F, Leppert D, Tomic D, Kappos L (2018) Neurofilament light levels in the blood of patients with secondary progressive MS are higher than in primary progressive MS and may predict brain atrophy in both MS subtypes. Multiple Sclerosis Journal. SAGE PUBLICATIONS LTD 1 OLIVERS YARD, 55 CITY ROAD, LONDON EC1Y 1SP, ENGLAND, City, pp 111-111 34. Lassmann H, van Horssen J, Mahad D (2012) Progressive multiple sclerosis: pathology and pathogenesis. Nat Rev Neurol 8: 647-656. https://doi.org/10.1038/nrneurol.2012.168 35. Le Page E, Veillard D, Laplaud DA, Hamonic S, Wardi R, Lebrun C, Zagnoli F, Wiertlewski S, Deburghgraeve V, Coustans M et al (2015) Oral versus intravenous high-dose methylprednisolone for treatment of relapses in patients with multiple sclerosis (COPOUSEP): a randomised, controlled, double-blind, non-inferiority trial. Lancet 386: 974-981. https://doi.org/10.1016/s0140-6736(15)61137-0 36. Leppert D, Kropshofer H, Häring DA, Dahlke F, Patil A, Meinert R, Tomic D, Kappos L, Kuhle J (2022) Blood Neurofilament Light in Progressive Multiple Sclerosis: Post Hoc Analysis of 2 Randomized Controlled Trials. Neurology 98: e2120-e2131. https://doi.org/10.1212/wnl.0000000000200258 37. Leussink VI, Jung S, Merschdorf U, Toyka KV, Gold R (2001) High-Dose Methylprednisolone Therapy in Multiple Sclerosis Induces Apoptosis in Peripheral Blood Leukocytes. Archives of Neurology 58: 91-97. https://doi.org/10.1001/archneur.58.1.91 38. Lim HY, Müller N, Herold MJ, van den Brandt J, Reichardt HM (2007) Glucocorticoids exert opposing effects on macrophage function dependent on their concentration. Immunology 122: 47-53. https://doi.org/10.1111/j.1365-2567.2007.02611.x 39. Luchetti S, Fransen NL, van Eden CG, Ramaglia V, Mason M, Huitinga I (2018) Progressive multiple sclerosis patients show substantial lesion activity that correlates with clinical disease severity and sex: a retrospective autopsy cohort analysis. Acta Neuropathol 135: 511-528. https://doi.org/10.1007/s00401-018-1818-y 40. Magliozzi R, Howell O, Vora A, Serafini B, Nicholas R, Puopolo M, Reynolds R, Aloisi F (2007) Meningeal B-cell follicles in secondary progressive multiple sclerosis associate with early onset of disease and severe cortical pathology. Brain 130: 1089-1104. https://doi.org/10.1093/brain/awm038 41. Mahad DH, Trapp BD, Lassmann H (2015) Pathological mechanisms in progressive multiple sclerosis. Lancet Neurol 14: 183-193. https://doi.org/10.1016/s1474-4422(14)70256-x 42. Martínez-Cáceres EM, Barrau MA, Brieva L, Espejo C, Barberà N, Montalban X (2002) Treatment with methylprednisolone in relapses of multiple sclerosis patients: immunological evidence of immediate and short-term but not long-lasting effects. Clin Exp Immunol 127: 165-171. https://doi.org/10.1046/j.1365-2249.2002.01725.x 43. Miller DH, Thompson AJ, Morrissey SP, MacManus DG, Moore SG, Kendall BE, Moseley IF, McDonald WI (1992) High dose steroids in acute relapses of multiple sclerosis: MRI evidence for a possible mechanism of therapeutic effect. J Neurol Neurosurg Psychiatry 55: 450-453. https://doi.org/10.1136/jnnp.55.6.450 44. Milligan NM, Newcombe R, Compston DA (1987) A double-blind controlled trial of high dose methylprednisolone in patients with multiple sclerosis: 1. Clinical effects. J Neurol Neurosurg Psychiatry 50: 511-516. https://doi.org/10.1136/jnnp.50.5.511 45. Ratzer R, Iversen P, Börnsen L, Dyrby TB, Romme Christensen J, Ammitzbøll C, Madsen CG, Garde E, Lyksborg M, Andersen B et al (2016) Monthly oral methylprednisolone pulse treatment in progressive multiple sclerosis. Mult Scler 22: 926-934. https://doi.org/10.1177/1352458515605908 46. Ravnborg M, Sørensen PS, Andersson M, Celius EG, Jongen PJ, Elovaara I, Bartholomé E, Constantinescu CS, Beer K, Garde E et al (2010) Methylprednisolone in combination with interferon beta-1a for relapsing-remitting multiple sclerosis (MECOMBIN study): a multicentre, double-blind, randomised, placebo-controlled, parallel-group trial. Lancet Neurol 9: 672-680. https://doi.org/10.1016/s1474-4422(10)70132-0 47. Salvador E, Shityakov S, Förster C (2014) Glucocorticoids and endothelial cell barrier function. Cell and tissue research 355: 597-605. https://doi.org/10.1007/s00441-013-1762-z 48. Shahim P, Politis A, van der Merwe A, Moore B, Chou YY, Pham DL, Butman JA, Diaz-Arrastia R, Gill JM, Brody DL et al (2020) Neurofilament light as a biomarker in traumatic brain injury. Neurology 95: e610-e622. https://doi.org/10.1212/wnl.0000000000009983 49. Smith LK, Cidlowski JA (2010) Glucocorticoid-induced apoptosis of healthy and malignant lymphocytes. Progress in brain research 182: 1-30. https://doi.org/10.1016/s0079-6123(10)82001-1 50. Spuler S, Yousry T, Scheller A, Voltz R, Holler E, Hartmann M, Wick M, Hohlfeld R (1996) Multiple sclerosis: Prospective analysis of TNF-alpha and 55 kDa TNF receptor in CSF and serum in correlation with clinical and MRI activity. Journal of Neuroimmunology 66: 57-64 51. Tanaka J, Fujita H, Matsuda S, Toku K, Sakanaka M, Maeda N (1997) Glucocorticoid- and mineralocorticoid receptors in microglial cells: the two receptors mediate differential effects of corticosteroids. Glia 20: 23-37 52. Thebault S, Abdoli M, Fereshtehnejad SM, Tessier D, Tabard-Cossa V, Freedman MS (2020) Serum neurofilament light chain predicts long term clinical outcomes in multiple sclerosis. Sci Rep 10: 11. https://doi.org/10.1038/s41598-020-67504-6 53. Thebault S, D RT, Lee H, Bowman M, Bar-Or A, Arnold DL, H LA, Tabard-Cossa V, Freedman MS (2019) High serum neurofilament light chain normalizes after hematopoietic stem cell transplantation for MS. Neurol Neuroimmunol Neuroinflamm 6: e598. https://doi.org/10.1212/nxi.0000000000000598 54. Thompson AJ, Banwell BL, Barkhof F, Carroll WM, Coetzee T, Comi G, Correale J, Fazekas F, Filippi M, Freedman MS et al (2018) Diagnosis of multiple sclerosis: 2017 revisions of the McDonald criteria. Lancet Neurol 17: 162-173. https://doi.org/10.1016/S1474-4422(17)30470-2 55. Thouvenot E, Demattei C, Uygunoglu U, Pittion S, Castelnovo G, Terdonck LDTd, Cohen M, Okuda D, Kantarci O, Pelletier D et al (2019) Neurofilament-Light Chain Levels Are Predictive of On-going Disease Activity in Radiologically Isolated Syndrome (S37.003). 92: S37.003 56. Zivadinov R, Sepcic J, Nasuelli D, De Masi R, Bragadin LM, Tommasi MA, Zambito-Marsala S, Moretti R, Bratina A, Ukmar M et al (2001) A longitudinal study of brain atrophy and cognitive disturbances in the early phase of relapsing-remitting multiple sclerosis. J Neurol Neurosurg Psychiatry 70: 773-780. https://doi.org/10.1136/jnnp.70.6.773 57. Zou HJ, Guo SW, Zhu L, Xu X, Liu JB (2021) Methylprednisolone Induces Neuro-Protective Effects via the Inhibition of A1 Astrocyte Activation in Traumatic Spinal Cord Injury Mouse Models. Front Neurosci 15: 628917. https://doi.org/10.3389/fnins.2021.628917
Copyright: © 2023 The author(s). This is an open access article distributed under the terms of the Creative Commons Attribution 4.0 International License (https://creativecommons.org/licenses/by/4.0/), which permits unrestricted use, distribution, and reproduction in any medium, provided the original author and source are credited, a link to the Creative Commons license is provided, and any changes are indicated. The Creative Commons Public Domain Dedication waiver (https://creativecommons.org/publicdomain/zero/1.0/) applies to the data made available in this article, unless otherwise stated. |
||||||||||||||||||||||||||||||||||||||||||||||||||||||||||||||||||||||||||||||||||||||||||||||||||||||||||